by Guy Woolley | Dec 13, 2020 | Finance

Date: December 11, 2020
In the October Market Newsletter, (Click here to review), I mentioned the market looked like it was going to get back to the all-time highs that it made on September 2nd. Looking at the charts below you can see this month the SP500, the NASDAQ, the Mid-Cap Index and the Small Cap Index attained new all-time highs. When all the style indexes are making new highs, it is very bullish.
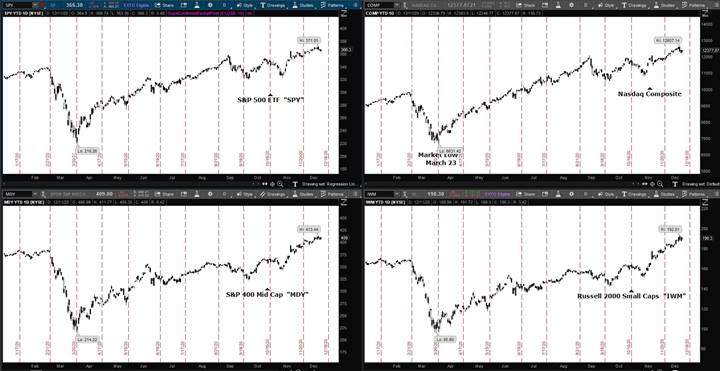
Pictured above is the S&P 500, Nasdaq Composite, S&P MidCap 400, Russell 2000 Small Cap ETF’s
Now as we approach the end of year; normal trading volume decreases, portfolio managers will sell to capture gains for the year, they will adjust portfolio positions to minimize capital gains, and buying new positions will decrease. So, do not be surprised if markets drift down from their recent highs. My indicators are still bullish, so I am not expecting a major selloff. Some of the recent rise in volatility has been due to the uncertainty over the expected stimulus package that our government is debating. On the bullish side is the release of the vaccine that is just beginning. On one of my trading monitors I have a dime, just to remind me that markets can change on a “Dime”.
To view my past Market Newsletters, go to www.freedomcapitalmanagement.com and on the home page you will see recent newsletters and for older newsletters go to the blog page tab at the top of the home page.
The VIX Index closed on Friday 12/11 at 23.31. The VIX Index has been rising for the last 3 days. A rising VIX is bearish for the markets. I prefer a VIX below 20 and a VIX below 15 is even more bullish.
Percent of stocks above their 50 day and 200 day moving average. 76% of stocks are above their 50-day moving average and 91% of the stocks are above their 200-day moving average. The 50-day being below the 200-day is because the last few days the markets have come off their highs. But when 60% of stocks are above their 200-day moving average, as they are now, that is bullish.
Federal Reserve: The next FOMC meeting is on December 16, 2020. On November 5th the Federal Reserve voted unanimously to maintain the current interest rate.
Unemployment Rate: Total nonfarm payroll employment rose by 245,000 in November, and the unemployment rate edged down to 6.7 percent, the U.S. Bureau of Labor Statistics reported on December 4th. These improvements in the labor market reflect the continued resumption of economic activity that had been curtailed due to the coronavirus (COVID-19) pandemic and efforts to contain it. However, the pace of improvement in the labor market has moderated in recent months. In November, notable job gains occurred in transportation and warehousing, professional and business services, and health care. Employment declined in government and retail trade.
Inflation Rate: The annual inflation rate for the United States is 1.2% for the 12 months ended November 2020, the same increase as previously, according to U.S. Labor Department data published on December 10, 2020.
Overall, the market is continuing to show bullish signs although as we approach the end of the year holidays, I expect the trading volume to decline.
In this month’s recap: Stock prices powered higher and energized investors thanks to a month-long succession of positive news events.
Monthly Economic Update

Presented by Guy Woolley, December 2020
U.S. Markets
Stock prices powered higher and emboldened investors in November thanks to a series of positive news events.
The Dow Jones Industrial Average, which has lagged much of the year, led the rally, jumping 11.84 percent. The Standard & Poor’s 500 Index tacked on 10.75 percent while the Nasdaq Composite rose 11.80 percent.1
All Eyes on the Election
Stocks opened the month strong, climbing throughout election week as bargain-hunting investors appeared to swoop in following a weak September and October.
While the immediate outcome of the presidential election was undecided, the projected results suggested a divided Congress, which investors interpreted as a productive environment for businesses.
Vaccine Booster
Stocks climbed higher on news of positive stage-three COVID-19 trial results that suggested a highly effective vaccine may be near at hand. Stocks that had been hurt by economic lockdowns surged on the news, while the stay-at-home stocks suffered steep declines. Bond yields and oil prices both moved higher on expectations of increased economic activity.
Positive momentum carried the Dow Jones Industrial Average, the S&P 500 index, and the Russell 2000 to record-high levels, with the Dow closing above the 30,000 mark.2
Companies Report Solid Quarter
While the U.S. election and progress on a coronavirus vaccine dominated the news cycle, companies in the S&P 500 reported solid earnings in the third quarter. As expected, the S&P 500 reported a year-over-year earnings of -6.3 percent. But when three hard-hit industries—energy, airlines, and hospitality—were excluded, earnings for S&P 500 companies grew by 4.3 percent.3
Sector Scorecard
All industry sectors moved higher in November, except Utilities, which fell 1.42 percent. The month saw strong gains in Communication Services (+7.34 percent), Consumer Discretionary (+5.49 percent), Consumer Staples (+3.95 percent), Energy (+34.54 percent), Financials (+17.50 percent), Health Care (+3.35 percent), Industrials (+14.74 percent), Materials (+12.50 percent), Real Estate (+5.96 percent), and Technology (+5.33 percent).4
What Investors May Be Talking About in December
After such a powerful rally, investors may be asking themselves, “What’s next for stock prices?”
Traders are expected to watch the trajectory of new COVID-19 infections and how they may influence economic activity over the coming weeks and months.
While investors recognize that there will be manufacturing and distribution challenges with approved vaccines, they may also be paying attention to when a vaccine may be available to the general public.

T I P O F T H E M O N T H

Some small business owners don’t have succession plans. If you haven’t created one, now is as good a time as any to start. This may not only enable continuity, but also address some legacy-strategy issues.

World Markets
Riding a global wave of optimism surrounding multiple COVID-19 vaccine trials, the MSCI-EAFE Index jumped 16.86 percent in November.5
European markets were broadly higher, with sharp gains in France, Germany, Italy, and the United Kingdom. European markets appeared to look beyond the new lockdowns and obstacles that prevented the passage of a European Union recovery package.6
Markets in the Pacific Rim also had a solid month. Australia picked up 9.96 percent while Japan tacked on 15.04 percent.7
Indicators
Gross Domestic Product: The second reading of GDP growth was unchanged from its initial estimate of up 33.1 percent on an annualized basis.8
Employment: The number of new jobs increased by 638,000 in October, which sent the unemployment rate lower by one percentage point to 6.9 percent.9
Retail Sales: Retail sales rose 0.3 percent, making November the sixth-straight month of increased consumer spending.10
Industrial Production: Industrial output jumped 1.1 percent, although production remains below its pre-pandemic February level.11
Housing: Housing starts increased by 4.9 percent, led by a 6.4 percent rise in single-family home starts.12
Existing home sales rose 4.3 percent in October, touching a 14-year high. Median prices also hit a new record high.13
New home sales dipped 0.3 percent, as declines in the West and South regions weighed on overall results.14
Consumer Price Index: The prices of consumer goods remained unchanged. However, in the last 12 months, prices have increased by 1.2 percent.15
Durable Goods Orders: Orders of long-lasting goods rose by 1.3 percent, which was above consensus estimates. The gain was driven by defense-related purchases.16

Q U O T E O F T H E M O N T H

“Remember that failure is an event, not a person.”
Zig Ziglar

The Fed
On November 25, the Federal Open Market Committee released the minutes from its November meeting. The minutes showed that the Fed discussed plans to offer more definitive guidance about its purchases of Treasuries and mortgage-backed securities by linking the purchase program to economic conditions.17
This new guidance may be introduced as early as their next meeting on December 15. The minutes also reflected the Committee’s concern about the lack of a new fiscal stimulus. However, the Fed also acknowledged a better-than-expected economic improvement in American households.17
|
MARKET INDEX
|
Y-T-D CHANGE
|
November 2020
|
|
DJIA
|
3.86%
|
11.85%
|
|
NASDAQ
|
35.96%
|
11.80%
|
|
S&P 500
|
12.10%
|
10.75%
|
| |
|
|
|
BOND YIELD
|
Y-T-D
|
November 2020
|
|
10 YR TREASURY
|
-1.08%
|
0.84%
|
Sources: Yahoo Finance, November 30, 2020
The market indexes discussed are unmanaged and generally considered representative of their respective markets. Individuals cannot directly invest in unmanaged indexes. Past performance does not guarantee future results. U.S. Treasury Notes are guaranteed by the federal government as to the timely payment of principal and interest. However, if you sell a Treasury Note prior to maturity, it may be worth more or less than the original price paid.

T H E M O N T H L Y R I D D L E

Daryl weighs 120 pounds more than his sister Julianne. Their combined weight is 180 pounds. How many pounds does Daryl weigh?
LAST MONTH’S RIDDLE: What is the significance of the following: The year is 1978, thirty-four minutes past noon on May 6th.
ANSWER: The time and month/date/year are 12:34, 5/6/78.

Guy Woolley may be reached at 415-236-5364 or guy@freedomcapitalmanagement.com
www.freedomcapitalmanagement.com
Know someone who could use information like this?
Please feel free to send us their contact information via phone or email. (Don’t worry – we’ll request their permission before adding them to our mailing list.)

«RepresentativeEmailDisclosure»
This material was prepared by MarketingPro, Inc., and does not necessarily represent the views of the presenting party, nor their affiliates. The information herein has been derived from sources believed to be accurate. Please note – investing involves risk, and past performance is no guarantee of future results. Investments will fluctuate and when redeemed may be worth more or less than when originally invested. This information should not be construed as investment, tax or legal advice and may not be relied on for the purpose of avoiding any Federal tax penalty. This is neither a solicitation nor recommendation to purchase or sell any investment or insurance product or service and should not be relied upon as such. All market indices discussed are unmanaged and are not illustrative of any particular investment. Indices do not incur management fees, costs, or expenses. Investors cannot invest directly in indices. All economic and performance data is historical and not indicative of future results. The Dow Jones Industrial Average is a price-weighted index of 30 actively traded blue-chip stocks. The NASDAQ Composite Index is a market-weighted index of all over-the-counter common stocks traded on the National Association of Securities Dealers Automated Quotation System. The Standard & Poor’s 500 (S&P 500) is a market-cap weighted index composed of the common stocks of 500 leading companies in leading industries of the U.S. economy. The Russell 2000 Index measures the performance of the small-cap segment of the U.S. equity universe. The CBOE Volatility Index® (VIX®) is a key measure of market expectations of near-term volatility conveyed by S&P 500 stock index option prices. NYSE Group, Inc. (NYSE:NYX) operates two securities exchanges: the New York Stock Exchange (the “NYSE”) and NYSE Arca (formerly known as the Archipelago Exchange, or ArcaEx®, and the Pacific Exchange). NYSE Group is a leading provider of securities listing, trading and market data products and services. The New York Mercantile Exchange, Inc. (NYMEX) is the world’s largest physical commodity futures exchange and the preeminent trading forum for energy and precious metals, with trading conducted through two divisions – the NYMEX Division, home to the energy, platinum, and palladium markets, and the COMEX Division, on which all other metals trade. The SSE Composite Index is an index of all stocks (A shares and B shares) that are traded at the Shanghai Stock Exchange. The CAC-40 Index is a narrow-based, modified capitalization-weighted index of 40 companies listed on the Paris Bourse. The FTSEurofirst 300 Index comprises the 300 largest companies ranked by market capitalization in the FTSE Developed Europe Index. The FTSE 100 Index is a share index of the 100 companies listed on the London Stock Exchange with the highest market capitalization. Established in January 1980, the All Ordinaries is the oldest index of shares in Australia. It is made up of the share prices for 500 of the largest companies listed on the Australian Securities Exchange. The S&P/TSX Composite Index is an index of the stock (equity) prices of the largest companies on the Toronto Stock Exchange (TSX) as measured by market capitalization. The Hang Seng Index is a free float-adjusted market capitalization-weighted stock market index that is the main indicator of the overall market performance in Hong Kong. The FTSE TWSE Taiwan 50 Index is a capitalization-weighted index of stocks comprises 50 companies listed on the Taiwan Stock Exchange developed by Taiwan Stock Exchange in collaboration with FTSE. The MSCI World Index is a free-float weighted equity index that includes developed world markets and does not include emerging markets. The Mexican Stock Exchange, commonly known as Mexican Bolsa, Mexbol, or BMV, is the only stock exchange in Mexico. The U.S. Dollar Index measures the performance of the U.S. dollar against a basket of six currencies. Additional risks are associated with international investing, such as currency fluctuations, political and economic instability and differences in accounting standards. This material represents an assessment of the market environment at a specific point in time and is not intended to be a forecast of future events, or a guarantee of future results. MarketingPro, Inc. is not affiliated with any person or firm that may be providing this information to you. The publisher is not engaged in rendering legal, accounting, or other professional services. If assistance is needed, the reader is advised to engage the services of a competent professional.
CITATIONS:
1. The Wall Street Journal, November 30, 2020
2. CNBC.com, November 23, 2020
3. FactSet Research, November 20, 2020
4. FactSet Research, November 30, 2020
5. MSCI.com, November 30, 2020
6. MSCI.com, November 30, 2020
7. MSCI.com, November 30, 2020
8. CNBC.com, November 25, 2020
9. The Wall Street Journal, November 6, 2020
10. The Wall Street Journal, November 17, 2020
11. The Wall Street Journal, November 17, 2020
12. MarketWatch.com, November 18, 2020
13. The Wall Street Journal, November 19, 2020
14. Reuters.com, November 25, 2020
15. The Wall Street Journal, November 12, 2020
16. MarketWatch.com, November 25, 2020
17. The Wall Street Journal, November 25, 2020
Guy Woolley
Registered Investment Advisor
Freedom Capital Management, Inc.
www.freedomcapitalmanagement.com
Direct: 415-236-5364
Toll Free: 866-357-2710
by Guy Woolley | Nov 9, 2020 | Finance

Date: November 8, 2020
The VIX Index can provide information utilizing recent market volatility, option premiums, and an expectation for mean reversion, as an indication of where the VIX Index is currently priced compared to its average price range. Comparing the VIX Index level to its average price range is helpful in identifying whether VIX is “high” or “low” and can provide indications of what the market is predicting about future prices. Generally, a rising VIX indicates Market weakness and a declining VIX indicates the Market is strengthening. I always write about the VIX Index price in the Monthly Market Update. Looking at the chart below one can see when the Market was at its high in February the VIX Index was below 20. When the Coronavirus began accelerating the Market declined and the VIX Index climbed to a high of 85.47. The VIX has been at higher levels then average since the Coronavirus. The VIX Index is also referred as the Fear Index. The VIX Index will rise because of news events, economic events, during earnings season and during political events, such as the Presidential Election. Here is my observation, since election day the VIX Index has been declining and the Market has been rising, that is a good sign. I am will be watching to see if the ballot recount will push the XIV higher causing the Market to decline. I have tried to show the “VIX to Market” relationship on the charts below.
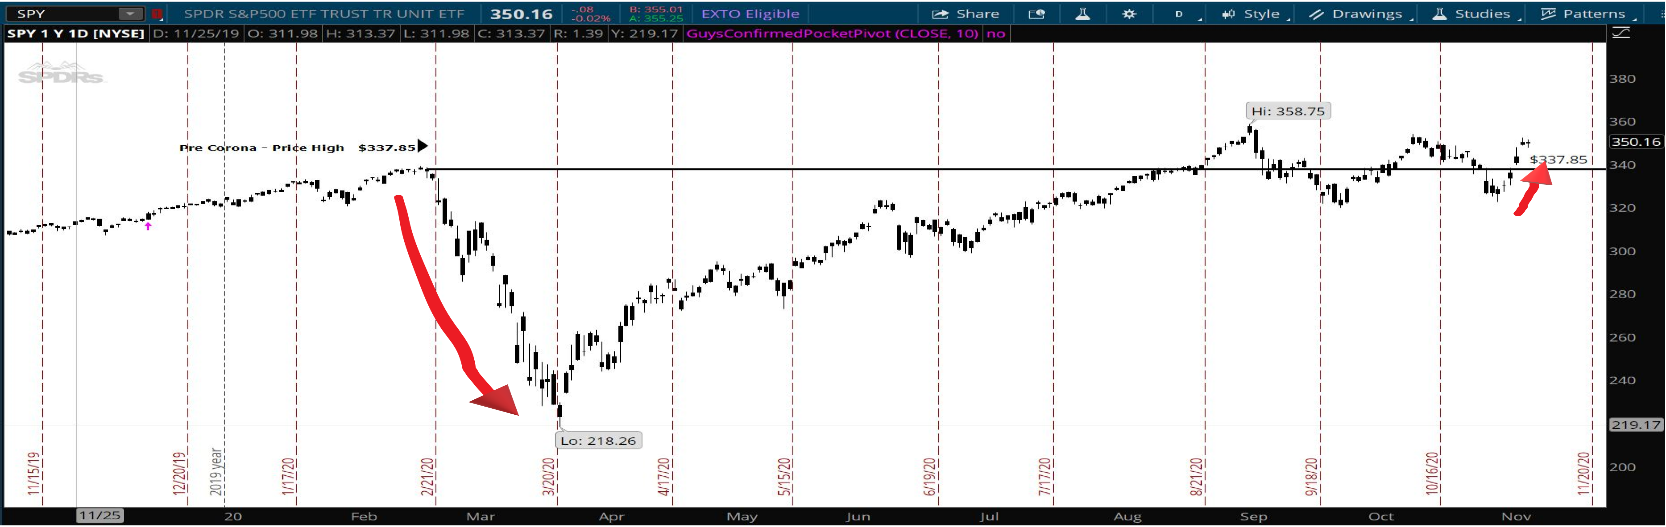
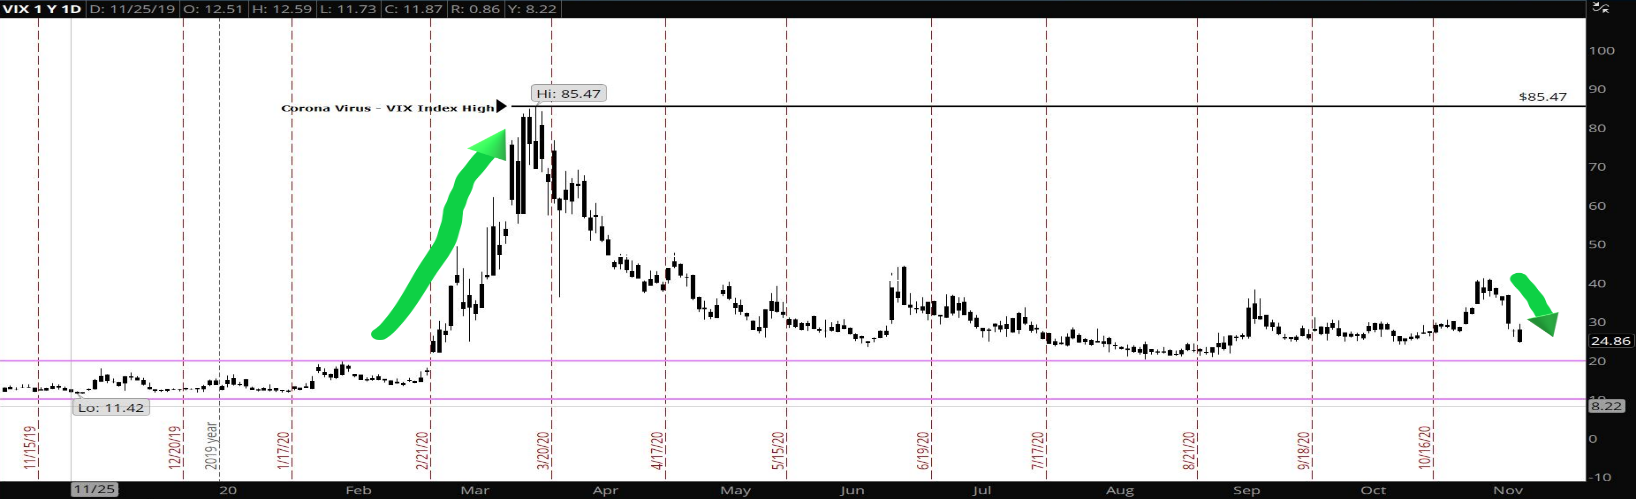
The top chart is the S&P 500 ETF (SPY), the chart below is the VIX Index. The pink channel at the bottom is the average range the VIX normally trades within. The VIX has been above the 20 average since 2/21/2020.
The VIX Index closed on Friday 11/6 at 24.86. That is the lowest it has been since 10/12. A declining VIX is bullish for the markets. A VIX below 15 is even more bullish.
Percent of stocks above their 50 day and 200 day moving average. 64% of stocks are above their 50-day moving average and 71% of the stocks are above their 200-day moving average. When 60% of stocks are above their 200-day moving average, that is very bullish.
Federal Reserve: The next FOMC meeting is on December 16, 2020. On November 5th the Federal Reserve voted unanimously to maintain the current interest rate.
Unemployment Rate: Total nonfarm payroll employment rose by 638,000 in October, and the unemployment rate declined to 6.9 percent, the U.S. Bureau of Labor Statistics reported on November 6th. In October, notable job gains occurred in leisure and hospitality, professional and business services, retail trade, and construction. Employment in government declined.
Inflation Rate: The annual inflation rate for the United States is 1.4% for the 12 months ended September 2020 as compared to 1.3% previously, according to U.S. Labor Department data published on October 13, 2020.
Overall, the market is bullish and we will be watching to see if the ballot recount will push the XIV higher causing the Market to decline.
In this month’s recap: Inaction on a second American fiscal stimulus bill and a rise in global COVID-19 cases put pressure on stock prices in October.
Monthly Economic Update

Presented by Guy Woolley, November 2020
U.S. Markets
Inaction on a second American fiscal stimulus bill and a rise in global COVID-19 cases put pressure on stock prices in October.
The Dow Jones Industrial Average, which has lagged much of the year, dropped 4.61 percent. The Standard & Poor’s 500 Index lost 2.77 percent and the Nasdaq Composite slipped 2.29 percent.1
All About Stimulus
The perceived progress by lawmakers to pass a new fiscal stimulus bill continued to move markets. When negotiations appeared to be on track, stocks moved higher but retreated as talks stalled.
Investor optimism regarding a second stimulus bill was highest at the start of the month, igniting strong gains as October got underway. Market sentiment was further buoyed by news of advances in COVID-19 treatments and a growing conviction that November’s election may be less contested than initially feared.
COVID’s Influence
As the month wore on, market optimism waned as the window to pass a stimulus bill closed. As hopes for a fiscal stimulus faded, an increase in new COVID-19 cases in the U.S. and Europe continued to sour market sentiment. This caused many investors to contemplate what a second coronavirus wave might do to the economic recovery.
Strong Earnings
Amid the attention the stimulus talks and COVID cases garnered, earnings season also began last month. By October 30th, with 64 percent of the S&P 500 companies having reported earnings, 86 percent had performed above Wall Street estimates and above the five-year average of 73 percent.2
These strong earnings results had little effect on a market overwhelmed by large-scale issues. Selling accelerated in the final week of trading with no movement on the fiscal stimulus bill, a bump up in COVID-related hospitalizations, and a reinstatement of partial lockdowns in Germany and France.
Sector Scorecard Pressure
Utilities (+5.05 percent) was the only sector to post a gain in October. Communication Services (-0.34 percent), Consumer Discretionary (-2.73 percent), Consumer Staples (-2.87 percent), Energy (-4.11 percent), Financials (-0.87 percent), Health Care (-3.62 percent), Industrials (-1.44 percent), Materials (-0.72 percent), Real Estate (-3.18 percent), and Technology (-5.00 percent) closed lower.3
What Investors May Be Talking About in November
The U.S. election will take center stage this month, with the critical concern being whether the election results will be clear and decisive.
Should President Trump remain in office, investors may expect him to follow similar policy initiatives during a second term. If former Vice President Biden is elected, investors will be listening closely to public statements and potential cabinet appointments to gain insight into his policy priorities.
Regardless of who is elected, the markets are expected to look for signs of a new stimulus measure.

T I P O F T H E M O N T H

Check your bank account regularly for fraud? If you don’t bank online – do you carefully check your monthly statements? If not, you should.

World Markets
A resurgence in COVID-19 infections, new economic lockdowns, and the growing prospect of a hard Brexit sent the MSCI-EAFE Index tumbling by 4.06 percent in October.4
Countries at the epicenter of the coronavirus resurgence in Europe were especially hard hit, with losses in Germany (-9.44 percent), France (-4. percent), Italy (-6.90 percent), and the U.K. (-4.92 percent).5
Pacific Rim stocks performed better, as Australia picked up 1.92 percent, and Hong Kong added 2.76 percent.6
Indicators
Gross Domestic Product: The economy expanded at a 33.1 percent annual rate in the third quarter, recouping about two-thirds of the pandemic-induced contraction suffered earlier in the year.7
Employment: Nonfarm payrolls grew by 661,000 in September. Hiring was slightly below expectations, but it was enough to drop the unemployment rate to 7.9 percent, down from the previous month’s 8.4 percent.8
Retail Sales: Consumer spending rose 1.9 percent, led by a 3.6 percent jump in motor vehicle sales. It was the fifth consecutive month of higher retail sales.9
Industrial Production: Industrial output fell 0.6 percent in September after four straight months of gains. Industrial production was 7.1 percent below its pre-pandemic February level.10
Housing: Housing starts rose 1.9 percent, as single-family home starts outweighed a decline in the more volatile multi-family segment.11
Existing home sales increased by 9.4 percent. Tight inventories drove the median home price higher to $311,800, a 14.8 percent jump from September 2019.12
After four straight months of increases, sales of new homes fell by 3.5 percent.13
Consumer Price Index: The cost of consumer goods rose by 0.2 percent in September, with a 6.7 percent jump in used cars and trucks. Additionally, inflation remained low, recording a 12-month increase of 1.4 percent.14
Durable Goods Orders: Orders for long-lasting goods rose 1.9 percent in September, the fifth consecutive month of increasing orders. Orders for nondefense capital goods, a proxy for business investment, went up by 1 percent.15

Q U O T E O F T H E M O N T H

“I have no special talents. I’m only passionately curious.”
ALBERT EINSTeIN

The Fed
The minutes from September’s Federal Open Market Committee meeting reflected a Federal Reserve highly focused on the economy’s current state. Members expressed concerns about the lack of additional fiscal stimulus, and some suggested this stimulus gap could derail a full economic recovery.
Members supported providing forward guidance on the federal funds rate, which has a current target rate of between 0.00 and 0.25 percent. They also supported the new Federal Open Market Committee language, indicating inflation would have to average above 2 percent for a period of time before adjusting short-term rates would be considered.16
|
MARKET INDEX
|
Y-T-D CHANGE
|
October 2020
|
|
DJIA
|
-7.14
|
-4.61%
|
|
NASDAQ
|
21.61%
|
-2.29%
|
|
S&P 500
|
1.21%
|
-2.77%
|
| |
|
|
|
BOND YIELD
|
Y-T-D
|
October 2020
|
|
10 YR TREASURY
|
-1.06%
|
0.86%
|
Sources: Yahoo Finance, October 31, 2020
Indices are unmanaged, do not incur fees or expenses, and cannot be invested into directly. These returns do not include dividends. 10-year Treasury real yield = projected return on investment, expressed as a percentage, on the U.S. government’s 10-year bond.

T H E M O N T H L Y R I D D L E

What is the significance of the following: The year is 1978, thirty-four minutes past noon on May 6th.
LAST MONTH’S RIDDLE: What is no sooner spoken than broken?
ANSWER: Silence.

Guy Woolley may be reached at 415-236-5364 or guy@freedomcapitalmanagement.com
www.freedomcapitalmanagement.com
Know someone who could use information like this?
Please feel free to send us their contact information via phone or email. (Don’t worry – we’ll request their permission before adding them to our mailing list.)

«RepresentativeEmailDisclosure»
This material was prepared by MarketingPro, Inc., and does not necessarily represent the views of the presenting party, nor their affiliates. The information herein has been derived from sources believed to be accurate. Please note – investing involves risk, and past performance is no guarantee of future results. Investments will fluctuate and when redeemed may be worth more or less than when originally invested. This information should not be construed as investment, tax or legal advice and may not be relied on for the purpose of avoiding any Federal tax penalty. This is neither a solicitation nor recommendation to purchase or sell any investment or insurance product or service and should not be relied upon as such. All market indices discussed are unmanaged and are not illustrative of any particular investment. Indices do not incur management fees, costs, or expenses. Investors cannot invest directly in indices. All economic and performance data is historical and not indicative of future results. The Dow Jones Industrial Average is a price-weighted index of 30 actively traded blue-chip stocks. The NASDAQ Composite Index is a market-weighted index of all over-the-counter common stocks traded on the National Association of Securities Dealers Automated Quotation System. The Standard & Poor’s 500 (S&P 500) is a market-cap weighted index composed of the common stocks of 500 leading companies in leading industries of the U.S. economy. The Russell 2000 Index measures the performance of the small-cap segment of the U.S. equity universe. The CBOE Volatility Index® (VIX®) is a key measure of market expectations of near-term volatility conveyed by S&P 500 stock index option prices. NYSE Group, Inc. (NYSE:NYX) operates two securities exchanges: the New York Stock Exchange (the “NYSE”) and NYSE Arca (formerly known as the Archipelago Exchange, or ArcaEx®, and the Pacific Exchange). NYSE Group is a leading provider of securities listing, trading and market data products and services. The New York Mercantile Exchange, Inc. (NYMEX) is the world’s largest physical commodity futures exchange and the preeminent trading forum for energy and precious metals, with trading conducted through two divisions – the NYMEX Division, home to the energy, platinum, and palladium markets, and the COMEX Division, on which all other metals trade. The SSE Composite Index is an index of all stocks (A shares and B shares) that are traded at the Shanghai Stock Exchange. The CAC-40 Index is a narrow-based, modified capitalization-weighted index of 40 companies listed on the Paris Bourse. The FTSEurofirst 300 Index comprises the 300 largest companies ranked by market capitalization in the FTSE Developed Europe Index. The FTSE 100 Index is a share index of the 100 companies listed on the London Stock Exchange with the highest market capitalization. Established in January 1980, the All Ordinaries is the oldest index of shares in Australia. It is made up of the share prices for 500 of the largest companies listed on the Australian Securities Exchange. The S&P/TSX Composite Index is an index of the stock (equity) prices of the largest companies on the Toronto Stock Exchange (TSX) as measured by market capitalization. The Hang Seng Index is a free float-adjusted market capitalization-weighted stock market index that is the main indicator of the overall market performance in Hong Kong. The FTSE TWSE Taiwan 50 Index is a capitalization-weighted index of stocks comprises 50 companies listed on the Taiwan Stock Exchange developed by Taiwan Stock Exchange in collaboration with FTSE. The MSCI World Index is a free-float weighted equity index that includes developed world markets and does not include emerging markets. The Mexican Stock Exchange, commonly known as Mexican Bolsa, Mexbol, or BMV, is the only stock exchange in Mexico. The U.S. Dollar Index measures the performance of the U.S. dollar against a basket of six currencies. Additional risks are associated with international investing, such as currency fluctuations, political and economic instability and differences in accounting standards. This material represents an assessment of the market environment at a specific point in time and is not intended to be a forecast of future events, or a guarantee of future results. MarketingPro, Inc. is not affiliated with any person or firm that may be providing this information to you. The publisher is not engaged in rendering legal, accounting or other professional services. If assistance is needed, the reader is advised to engage the services of a competent professional.
CITATIONS:
1. The Wall Street Journal, October 31, 2020
2. FactSet Research, October 30, 2020
3. FactSet Research, October 31, 2020
4. MSCI.com, October 31, 2020
5. MSCI.com, October 31, 2020
6. MSCI.com, October 31, 2020
7. The Wall Street Journal, October 29, 2020
8. The Wall Street Journal, October 2, 2020
9. The Wall Street Journal, October 16, 2020
10. The Wall Street Journal, October 16, 2020
11. CNBC.com, October 20, 2020
12. CNBC.com, October 22, 2020
13. Reuters.com, October 26, 2020
14. Reuters.com, October 13, 2020
15. The Wall Street Journal, October 27, 2020
16. CNBC.com, October 7, 2020
Date: November 8, 2020
The VIX Index can provide information utilizing recent market volatility, option premiums, and an expectation for mean reversion, as an indication of where the VIX Index is currently priced compared to its average price range. Comparing the VIX Index level to its average price range is helpful in identifying whether VIX is “high” or “low” and can provide indications of what the market is predicting about future prices. Generally, a rising VIX indicates Market weakness and a declining VIX indicates the Market is strengthening. I always write about the VIX Index price in the Monthly Market Update. Looking at the chart below one can see when the Market was at its high in February the VIX Index was below 20. When the Coronavirus began accelerating the Market declined and the VIX Index climbed to a high of 85.47. The VIX has been at higher levels then average since the Coronavirus. The VIX Index is also referred as the Fear Index. The VIX Index will rise because of news events, economic events, during earnings season and during political events, such as the Presidential Election. Here is my observation, since election day the VIX Index has been declining and the Market has been rising, that is a good sign. I am will be watching to see if the ballot recount will push the XIV higher causing the Market to decline. I have tried to show the “VIX to Market” relationship on the charts below.
The top chart is the S&P 500 ETF (SPY), the chart below is the VIX Index. The pink channel at the bottom is the average range the VIX normally trades within. The VIX has been above the 20 average since 2/21/2020.
The VIX Index closed on Friday 11/6 at 24.86. That is the lowest it has been since 10/12. A declining VIX is bullish for the markets. A VIX below 15 is even more bullish.
Percent of stocks above their 50 day and 200 day moving average. 64% of stocks are above their 50-day moving average and 71% of the stocks are above their 200-day moving average. When 60% of stocks are above their 200-day moving average, that is very bullish.
Federal Reserve: The next FOMC meeting is on December 16, 2020. On November 5th the Federal Reserve voted unanimously to maintain the current interest rate.
Unemployment Rate: Total nonfarm payroll employment rose by 638,000 in October, and the unemployment rate declined to 6.9 percent, the U.S. Bureau of Labor Statistics reported on November 6th. In October, notable job gains occurred in leisure and hospitality, professional and business services, retail trade, and construction. Employment in government declined.
Inflation Rate: The annual inflation rate for the United States is 1.4% for the 12 months ended September 2020 as compared to 1.3% previously, according to U.S. Labor Department data published on October 13, 2020.
Overall, the market is bullish and we will be watching to see if the ballot recount will push the XIV higher causing the Market to decline.
In this month’s recap: Inaction on a second American fiscal stimulus bill and a rise in global COVID-19 cases put pressure on stock prices in October.
Monthly Economic Update
Presented by Guy Woolley, November 2020
U.S. Markets
Inaction on a second American fiscal stimulus bill and a rise in global COVID-19 cases put pressure on stock prices in October.
The Dow Jones Industrial Average, which has lagged much of the year, dropped 4.61 percent. The Standard & Poor’s 500 Index lost 2.77 percent and the Nasdaq Composite slipped 2.29 percent.1
All About Stimulus
The perceived progress by lawmakers to pass a new fiscal stimulus bill continued to move markets. When negotiations appeared to be on track, stocks moved higher but retreated as talks stalled.
Investor optimism regarding a second stimulus bill was highest at the start of the month, igniting strong gains as October got underway. Market sentiment was further buoyed by news of advances in COVID-19 treatments and a growing conviction that November’s election may be less contested than initially feared.
COVID’s Influence
As the month wore on, market optimism waned as the window to pass a stimulus bill closed. As hopes for a fiscal stimulus faded, an increase in new COVID-19 cases in the U.S. and Europe continued to sour market sentiment. This caused many investors to contemplate what a second coronavirus wave might do to the economic recovery.
Strong Earnings
Amid the attention the stimulus talks and COVID cases garnered, earnings season also began last month. By October 30th, with 64 percent of the S&P 500 companies having reported earnings, 86 percent had performed above Wall Street estimates and above the five-year average of 73 percent.2
These strong earnings results had little effect on a market overwhelmed by large-scale issues. Selling accelerated in the final week of trading with no movement on the fiscal stimulus bill, a bump up in COVID-related hospitalizations, and a reinstatement of partial lockdowns in Germany and France.
Sector Scorecard Pressure
Utilities (+5.05 percent) was the only sector to post a gain in October. Communication Services (-0.34 percent), Consumer Discretionary (-2.73 percent), Consumer Staples (-2.87 percent), Energy (-4.11 percent), Financials (-0.87 percent), Health Care (-3.62 percent), Industrials (-1.44 percent), Materials (-0.72 percent), Real Estate (-3.18 percent), and Technology (-5.00 percent) closed lower.3
What Investors May Be Talking About in November
The U.S. election will take center stage this month, with the critical concern being whether the election results will be clear and decisive.
Should President Trump remain in office, investors may expect him to follow similar policy initiatives during a second term. If former Vice President Biden is elected, investors will be listening closely to public statements and potential cabinet appointments to gain insight into his policy priorities.
Regardless of who is elected, the markets are expected to look for signs of a new stimulus measure.
T I P O F T H E M O N T H
Check your bank account regularly for fraud? If you don’t bank online – do you carefully check your monthly statements? If not, you should.
World Markets
A resurgence in COVID-19 infections, new economic lockdowns, and the growing prospect of a hard Brexit sent the MSCI-EAFE Index tumbling by 4.06 percent in October.4
Countries at the epicenter of the coronavirus resurgence in Europe were especially hard hit, with losses in Germany (-9.44 percent), France (-4. percent), Italy (-6.90 percent), and the U.K. (-4.92 percent).5
Pacific Rim stocks performed better, as Australia picked up 1.92 percent, and Hong Kong added 2.76 percent.6
Indicators
Gross Domestic Product: The economy expanded at a 33.1 percent annual rate in the third quarter, recouping about two-thirds of the pandemic-induced contraction suffered earlier in the year.7
Employment: Nonfarm payrolls grew by 661,000 in September. Hiring was slightly below expectations, but it was enough to drop the unemployment rate to 7.9 percent, down from the previous month’s 8.4 percent.8
Retail Sales: Consumer spending rose 1.9 percent, led by a 3.6 percent jump in motor vehicle sales. It was the fifth consecutive month of higher retail sales.9
Industrial Production: Industrial output fell 0.6 percent in September after four straight months of gains. Industrial production was 7.1 percent below its pre-pandemic February level.10
Housing: Housing starts rose 1.9 percent, as single-family home starts outweighed a decline in the more volatile multi-family segment.11
Existing home sales increased by 9.4 percent. Tight inventories drove the median home price higher to $311,800, a 14.8 percent jump from September 2019.12
After four straight months of increases, sales of new homes fell by 3.5 percent.13
Consumer Price Index: The cost of consumer goods rose by 0.2 percent in September, with a 6.7 percent jump in used cars and trucks. Additionally, inflation remained low, recording a 12-month increase of 1.4 percent.14
Durable Goods Orders: Orders for long-lasting goods rose 1.9 percent in September, the fifth consecutive month of increasing orders. Orders for nondefense capital goods, a proxy for business investment, went up by 1 percent.15
Q U O T E O F T H E M O N T H
“I have no special talents. I’m only passionately curious.”
ALBERT EINSTeIN
The Fed
The minutes from September’s Federal Open Market Committee meeting reflected a Federal Reserve highly focused on the economy’s current state. Members expressed concerns about the lack of additional fiscal stimulus, and some suggested this stimulus gap could derail a full economic recovery.
Members supported providing forward guidance on the federal funds rate, which has a current target rate of between 0.00 and 0.25 percent. They also supported the new Federal Open Market Committee language, indicating inflation would have to average above 2 percent for a period of time before adjusting short-term rates would be considered.16
|
MARKET INDEX
|
Y-T-D CHANGE
|
October 2020
|
|
DJIA
|
-7.14
|
-4.61%
|
|
NASDAQ
|
21.61%
|
-2.29%
|
|
S&P 500
|
1.21%
|
-2.77%
|
| |
|
|
|
BOND YIELD
|
Y-T-D
|
October 2020
|
|
10 YR TREASURY
|
-1.06%
|
0.86%
|
Sources: Yahoo Finance, October 31, 2020
Indices are unmanaged, do not incur fees or expenses, and cannot be invested into directly. These returns do not include dividends. 10-year Treasury real yield = projected return on investment, expressed as a percentage, on the U.S. government’s 10-year bond.
T H E M O N T H L Y R I D D L E
What is the significance of the following: The year is 1978, thirty-four minutes past noon on May 6th.
LAST MONTH’S RIDDLE: What is no sooner spoken than broken?
ANSWER: Silence.
Guy Woolley may be reached at 415-236-5364 or guy@freedomcapitalmanagement.com
www.freedomcapitalmanagement.com
Know someone who could use information like this?
Please feel free to send us their contact information via phone or email. (Don’t worry – we’ll request their permission before adding them to our mailing list.)
«RepresentativeEmailDisclosure»
This material was prepared by MarketingPro, Inc., and does not necessarily represent the views of the presenting party, nor their affiliates. The information herein has been derived from sources believed to be accurate. Please note – investing involves risk, and past performance is no guarantee of future results. Investments will fluctuate and when redeemed may be worth more or less than when originally invested. This information should not be construed as investment, tax or legal advice and may not be relied on for the purpose of avoiding any Federal tax penalty. This is neither a solicitation nor recommendation to purchase or sell any investment or insurance product or service and should not be relied upon as such. All market indices discussed are unmanaged and are not illustrative of any particular investment. Indices do not incur management fees, costs, or expenses. Investors cannot invest directly in indices. All economic and performance data is historical and not indicative of future results. The Dow Jones Industrial Average is a price-weighted index of 30 actively traded blue-chip stocks. The NASDAQ Composite Index is a market-weighted index of all over-the-counter common stocks traded on the National Association of Securities Dealers Automated Quotation System. The Standard & Poor’s 500 (S&P 500) is a market-cap weighted index composed of the common stocks of 500 leading companies in leading industries of the U.S. economy. The Russell 2000 Index measures the performance of the small-cap segment of the U.S. equity universe. The CBOE Volatility Index® (VIX®) is a key measure of market expectations of near-term volatility conveyed by S&P 500 stock index option prices. NYSE Group, Inc. (NYSE:NYX) operates two securities exchanges: the New York Stock Exchange (the “NYSE”) and NYSE Arca (formerly known as the Archipelago Exchange, or ArcaEx®, and the Pacific Exchange). NYSE Group is a leading provider of securities listing, trading and market data products and services. The New York Mercantile Exchange, Inc. (NYMEX) is the world’s largest physical commodity futures exchange and the preeminent trading forum for energy and precious metals, with trading conducted through two divisions – the NYMEX Division, home to the energy, platinum, and palladium markets, and the COMEX Division, on which all other metals trade. The SSE Composite Index is an index of all stocks (A shares and B shares) that are traded at the Shanghai Stock Exchange. The CAC-40 Index is a narrow-based, modified capitalization-weighted index of 40 companies listed on the Paris Bourse. The FTSEurofirst 300 Index comprises the 300 largest companies ranked by market capitalization in the FTSE Developed Europe Index. The FTSE 100 Index is a share index of the 100 companies listed on the London Stock Exchange with the highest market capitalization. Established in January 1980, the All Ordinaries is the oldest index of shares in Australia. It is made up of the share prices for 500 of the largest companies listed on the Australian Securities Exchange. The S&P/TSX Composite Index is an index of the stock (equity) prices of the largest companies on the Toronto Stock Exchange (TSX) as measured by market capitalization. The Hang Seng Index is a free float-adjusted market capitalization-weighted stock market index that is the main indicator of the overall market performance in Hong Kong. The FTSE TWSE Taiwan 50 Index is a capitalization-weighted index of stocks comprises 50 companies listed on the Taiwan Stock Exchange developed by Taiwan Stock Exchange in collaboration with FTSE. The MSCI World Index is a free-float weighted equity index that includes developed world markets and does not include emerging markets. The Mexican Stock Exchange, commonly known as Mexican Bolsa, Mexbol, or BMV, is the only stock exchange in Mexico. The U.S. Dollar Index measures the performance of the U.S. dollar against a basket of six currencies. Additional risks are associated with international investing, such as currency fluctuations, political and economic instability and differences in accounting standards. This material represents an assessment of the market environment at a specific point in time and is not intended to be a forecast of future events, or a guarantee of future results. MarketingPro, Inc. is not affiliated with any person or firm that may be providing this information to you. The publisher is not engaged in rendering legal, accounting or other professional services. If assistance is needed, the reader is advised to engage the services of a competent professional.
CITATIONS:
1. The Wall Street Journal, October 31, 2020
2. FactSet Research, October 30, 2020
3. FactSet Research, October 31, 2020
4. MSCI.com, October 31, 2020
5. MSCI.com, October 31, 2020
6. MSCI.com, October 31, 2020
7. The Wall Street Journal, October 29, 2020
8. The Wall Street Journal, October 2, 2020
9. The Wall Street Journal, October 16, 2020
10. The Wall Street Journal, October 16, 2020
11. CNBC.com, October 20, 2020
12. CNBC.com, October 22, 2020
13. Reuters.com, October 26, 2020
14. Reuters.com, October 13, 2020
15. The Wall Street Journal, October 27, 2020
16. CNBC.com, October 7, 2020