Freedom Capital Management August Market Update (Click for full article)

August 6, 2021
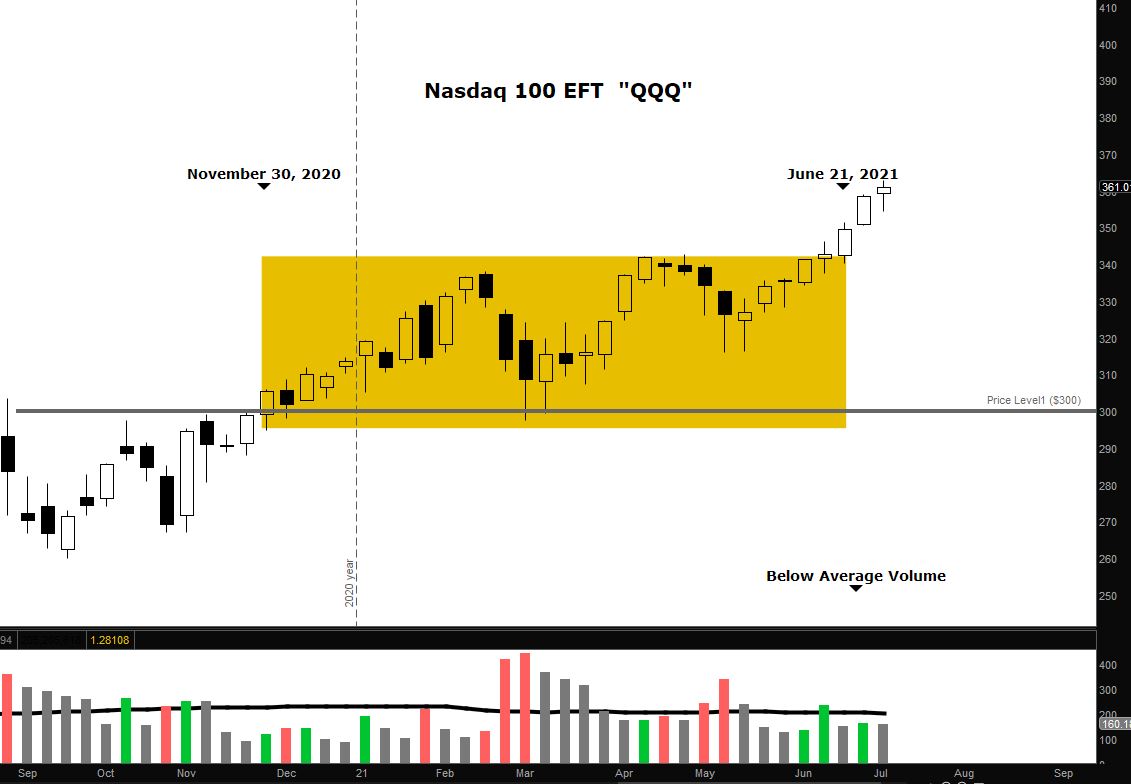
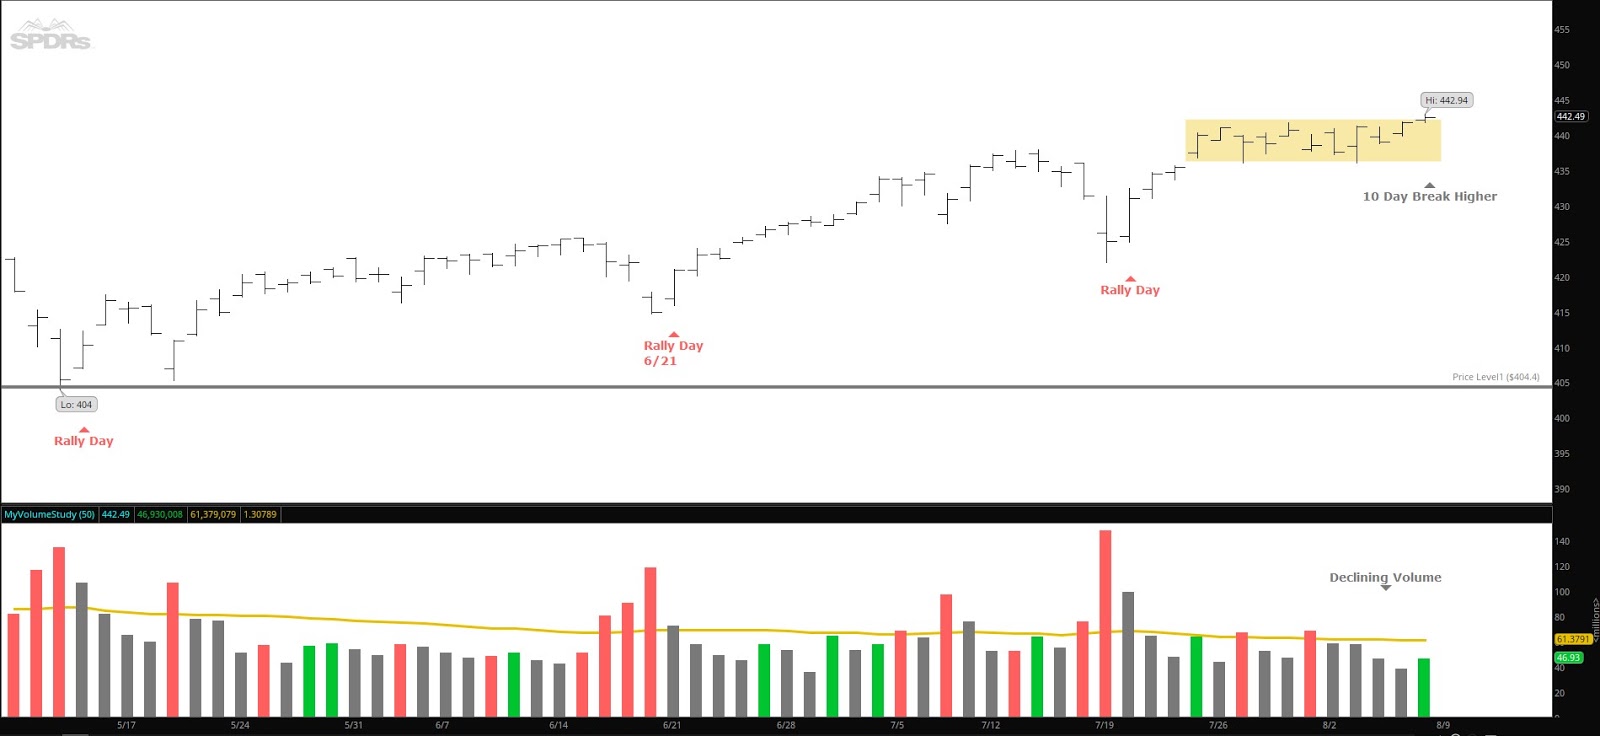
Once again, both the S&P 500 and the Nasdaq are making all-time highs. I highlighted the chart below of the S&P 500 ETF attempting to break higher after 10 days of consolidation.
Corporate earnings have remained strong during this earnings period. As reported by Factset on Friday August 6th, “Overall, 89% of the companies in the S&P 500 have reported actual results for Q2 2021 to date. Of these companies, 87% have reported actual EPS above estimates, which is above the five-year average of 75%. If 87% is the final percentage for the quarter, it will mark the highest percentage of S&P 500 companies reporting a positive EPS surprise since FactSet began tracking this metric in 2008. In aggregate, companies are reporting earnings that are 17.1% above estimates, which is also above the five-year average of 7.8%. If 17.1% is the final percentage for the quarter, it will mark the fourth-largest earnings surprise percentage reported by the index since FactSet began tracking this metric in 2008.”
The indicators we watch continue to suggest the strength in the markets. The only negative is the rising Inflation rate, which traders will be watching closely. Markets can turn on a dime quickly but for now I remain encouraged by the upward direction.
The VIX Index closed on Friday 8/6 at 16.15. The market is rising and the VIX continues to trade lower. A falling VIX is bullish for the markets. I prefer the VIX below 20 and a VIX below 15 is even more bullish.
Percent of stocks above their 50 day and 200 day moving average: Last month 63% of stocks were above their 50-day moving average, this month 62% are above their 50-day moving average but since 6/18 this average is rising. Last month 91% of the stocks are above their 200-day moving average, today 83% are above their 200-day moving average. When 60% of stocks are above their 200-day moving average and the 50-day is rising, that is bullish. It would be a sign of strength if the stocks above their 50-day moving average continue to rise.
Federal Reserve: The next FOMC meeting announcement will be September 22nd. A comment from the FOMC press release from July 28th: “The path of the economy continues to depend on the course of the virus. Progress on vaccinations will likely continue to reduce the effects of the public health crisis on the economy, but risks to the economic outlook remain”.
Unemployment Rate: Total nonfarm payroll employment rose by 943,000 in July, and the unemployment rate declined by 0.5 percentage point to 5.4 percent, the U.S. Bureau of Labor Statistics reported August 6th. Notable job gains occurred in leisure and hospitality, in local government education, and in professional and business services.
Inflation Rate: The annual inflation rate for the United States is 5.4% for the 12 months ended June 2021 after rising 5.0% previously, according to U.S. Labor Department data published July 13. The next inflation update is scheduled for release on August 11 at 8:30 a.m. ET. It will offer the rate of inflation over the 12 months ended July 2021.
The 10-year Treasury index yield: 1.29%.
Overall, the markets are in an upward bias, making new highs, and continue to show strength, trading calmly with a low VIX index rating.
NOTE: To view past Market Newsletters, go to www.freedomcapitalmanagement.com and on the home page you will see recent newsletters and for older newsletters go to the blog page tab at the top of the home page.
In this month’s recap: Stocks notched a solid gain as investors looked past higher inflation and new COVID-19 cases.
Monthly Economic Update
![]()
Presented by Guy Woolley, August 2021
U.S. Markets
Last month, the stock market posted a solid gain, overcoming investors’ fears of higher inflation and an increase in COVID-19 cases.
The Dow Jones Industrial Average picked up 1.25 percent, while the Standard & Poor’s 500 Index gained 2.27 percent. The Nasdaq lagged, climbing 1.16 percent.1
A Wall of Worry
Climbing a wall of worry, investors weathered a choppy month as markets digested a jump in consumer prices and the continued spread of the Delta variant.
Inflation, which has been an increasing concern, hit levels not seen in decades. Consumer prices in June rose 5.4 percent, the biggest monthly gain since 2008. Meanwhile, producer prices, often a harbinger of future consumer prices, surged 7.3 percent from a year earlier. But both reports were primarily met with a collective shrug by investors.2
More troubling, however, was the global spread of the Delta variant. Throughout the month, investor anxiety grew around fears that a resurgence of COVID-19 cases could stall further economic recovery.
Corporate Profits
As July closed, 221 Standard & Poor’s 500 companies had reported earnings, with 91 percent of those companies beating Wall Street’s estimates. Companies also reported strong sales, topping estimates by nearly 24 percent.3
Stocks took a breather in the final week, despite the Federal Reserve’s renewed assurances that its near-zero interest rate policy would remain in place.4
Sector Scorecard
Energy was the only industry sector that fell last month, declining 5.68 percent. Otherwise, gains were posted in Communication Services (+1.92 percent), Consumer Discretionary (+3.26 percent), Consumer Staples (+2.82 percent), Financials (+0.77 percent), Health Care (+4.76 percent), Industrials (+1.92 percent), Materials (+1.94 percent), Real Estate (+3.47 percent), Technology (+3.84 percent), and Utilities (+5.02 percent).5
What Investors May Be Talking About in August
The rise in global COVID-19 cases last month unsettled investors, who worried about what it could mean for economic growth.
Some expect the recent surge to peak in August, while others see a peak in mid-September to early October.6
Any new surge is unlikely to mirror the experience in 2020. However, some investors may remain watchful as local, state, and federal entities weigh further restrictions.
![]()
T I P O F T H E M O N T H
![]()
Have you talked to your spouse or partner about your retirement goals? This is vital. See how your individual visions of retirement correspond or differ.
![]()
World Markets
The MSCI-EAFE Index trended higher, picking up 1.60 percent in July. However, different parts of the globe showed mixed results.7
In Europe, France was under pressure, dropping 1.69 percent, while Germany (+0.09 percent) and the U.K. (+0.07) posted modest gains.8
Australia rose 1.09 percent to lead the Pacific Rim markets. But Hong Kong dropped 9.94 percent as Chinese regulators continue their push to rein in large companies for reasons that include data security, corporate behavior, financial stability, and curtailing private-sector power.9
Indicators
Gross Domestic Product: The economy grew by an annualized rate of 6.5 percent in the second quarter. The growth rate, however, was well below economists’ expectations of 8.4 percent.10
Employment: Employers added 850,000 new jobs in June, marking the most significant increase since August 2020. However, the unemployment rate ticked higher to 5.9 percent due to a larger number of Americans seeking employment.11
Retail Sales: Retail sales rose 0.6 percent, despite a two percent decline in auto sales. Sales were particularly strong at restaurants, bars, and clothing stores.12
Industrial Production: Industrial production increased 0.4 percent, though manufacturing output declined due to reduced automobile production.13
Housing: Housing starts rose 6.3 percent in June, exceeding economists’ expectations.14
Sales of existing homes rose 1.4 percent after four consecutive months of declines. Inventories ticked higher, while demand softened a bit.15
New home sales slumped 6.6 percent, suggesting that high prices are cutting into demand.16
Consumer Price Index: Consumer prices jumped by 5.4 percent in June, registering the highest 12-month rate of change since August 2008. The core CPI, which excludes the more volatile food and energy sectors, increased by 4.5 percent.17
Durable Goods Orders: New orders for durable goods rose 0.8 percent in June. This is the thirteenth month out of the last 14 in which durable goods orders registered a gain.18
![]()
Q U O T E O F T H E M O N T H

“Believe you can and you’re halfway there.”
THEODORE ROOSEVELT
![]()
The Fed
The Federal Reserve reaffirmed that its monthly bond purchase program would continue until the Fed sees substantial progress in its inflation and employment goals.19
“Our asset purchases have been a critical tool,” Fed Chair Jerome Powell stated. “They helped preserve financial stability and market functioning early in the pandemic and, since then, have helped foster accommodative financial conditions to support the economy.”20
Some analysts have suggested that the Federal Reserve’s assessment of economic progress was potentially a hint that the tapering of bond purchases may be close.
| MARKET INDEX | Y-T-D CHANGE | July 2021 |
| DJIA | 14.14% | 1.25% |
| NASDAQ | 13.85% | 1.16% |
| S&P 500 | 17.02% | 2.27% |
| BOND YIELD | Y-T-D | July 2021 |
| 10 YR TREASURY | 0.32% | 1.24% |
Sources: Yahoo Finance, July 31, 2021.
The market indexes discussed are unmanaged and generally considered representative of their respective markets. Individuals cannot directly invest in unmanaged indexes. Past performance does not guarantee future results. U.S. Treasury Notes are guaranteed by the federal government as to the timely payment of principal and interest. However, if you sell a Treasury Note prior to maturity, it may be worth more or less than the original price paid.
![]()
T H E M O N T H L Y R I D D L E
![]()
An auto dealership sold 150 cars in a special 6-day tent sale offer. Each day the dealership sold 6 more cars than the day before. How many cars were sold on the 6th day?
LAST MONTH’S RIDDLE: You stand 8’ away from a door. With each move, you advance half the distance to the door. How many moves will it take to reach the door?
ANSWER: You will never actually reach the door. If all you do is advance half the distance to the door with every move, you will simply get closer and closer to it but still have half of the remaining distance left.
![]()
Guy Woolley may be reached at 415-236-5364 or guy@freedomcapitalmanagement.com
www.freedomcapitalmanagement.com
Know someone who could use information like this?
Please feel free to send us their contact information via phone or email. (Don’t worry – we’ll request their permission before adding them to our mailing list.)
![]()
«RepresentativeEmailDisclosure»
This material was prepared by MarketingPro, Inc., and does not necessarily represent the views of the presenting party, nor their affiliates. The information herein has been derived from sources believed to be accurate. Please note – investing involves risk, and past performance is no guarantee of future results. Investments will fluctuate and when redeemed may be worth more or less than when originally invested. This information should not be construed as investment, tax or legal advice and may not be relied on for the purpose of avoiding any Federal tax penalty. This is neither a solicitation nor recommendation to purchase or sell any investment or insurance product or service, and should not be relied upon as such. All market indices discussed are unmanaged and are not illustrative of any particular investment. Indices do not incur management fees, costs, or expenses. Investors cannot invest directly in indices. All economic and performance data is historical and not indicative of future results. The Dow Jones Industrial Average is a price-weighted index of 30 actively traded blue-chip stocks. The NASDAQ Composite Index is a market-weighted index of all over-the-counter common stocks traded on the National Association of Securities Dealers Automated Quotation System. The Standard & Poor’s 500 (S&P 500) is a market-cap weighted index composed of the common stocks of 500 leading companies in leading industries of the U.S. economy. The Russell 2000 Index measures the performance of the small-cap segment of the U.S. equity universe. The CBOE Volatility Index® (VIX®) is a key measure of market expectations of near-term volatility conveyed by S&P 500 stock index option prices. NYSE Group, Inc. (NYSE:NYX) operates two securities exchanges: the New York Stock Exchange (the “NYSE”) and NYSE Arca (formerly known as the Archipelago Exchange, or ArcaEx®, and the Pacific Exchange). NYSE Group is a leading provider of securities listing, trading and market data products and services. The New York Mercantile Exchange, Inc. (NYMEX) is the world’s largest physical commodity futures exchange and the preeminent trading forum for energy and precious metals, with trading conducted through two divisions – the NYMEX Division, home to the energy, platinum, and palladium markets, and the COMEX Division, on which all other metals trade. The SSE Composite Index is an index of all stocks (A shares and B shares) that are traded at the Shanghai Stock Exchange. The CAC-40 Index is a narrow-based, modified capitalization-weighted index of 40 companies listed on the Paris Bourse. The FTSEurofirst 300 Index comprises the 300 largest companies ranked by market capitalization in the FTSE Developed Europe Index. The FTSE 100 Index is a share index of the 100 companies listed on the London Stock Exchange with the highest market capitalization. Established in January 1980, the All Ordinaries is the oldest index of shares in Australia. It is made up of the share prices for 500 of the largest companies listed on the Australian Securities Exchange. The S&P/TSX Composite Index is an index of the stock (equity) prices of the largest companies on the Toronto Stock Exchange (TSX) as measured by market capitalization. The Hang Seng Index is a free float-adjusted market capitalization-weighted stock market index that is the main indicator of the overall market performance in Hong Kong. The FTSE TWSE Taiwan 50 Index is a capitalization-weighted index of stocks comprising 50 companies listed on the Taiwan Stock Exchange developed by Taiwan Stock Exchange in collaboration with FTSE. The MSCI World Index is a free-float weighted equity index that includes developed world markets and does not include emerging markets. The Mexican Stock Exchange, commonly known as Mexican Bolsa, Mexbol, or BMV, is the only stock exchange in Mexico. The U.S. Dollar Index measures the performance of the U.S. dollar against a basket of six currencies. Additional risks are associated with international investing, such as currency fluctuations, political and economic instability, and differences in accounting standards. This material represents an assessment of the market environment at a specific point in time and is not intended to be a forecast of future events or a guarantee of future results. MarketingPro, Inc. is not affiliated with any person or firm that may be providing this information to you. The publisher is not engaged in rendering legal, accounting, or other professional services. If assistance is needed, the reader is advised to engage the services of a competent professional.
CITATIONS:
1. The Wall Street Journal, July 31, 2021
2. CNBC.com, July 17, 2021
3. Twitter.com/EarningsScout, July 29, 2021
4. The Wall Street Journal, July 28, 2021
5. Sectorspdr.com, July 31, 2021
6. Johns Hopkins Bloomberg School of Public Health, June 17, 2021
7. MSCI.com, July 31, 2021
8. MSCI.com, July 31, 2021
9. MSCI.com, July 31, 2021
10. The Wall Street Journal, July 29, 2021
11. The Wall Street Journal, July 2, 2021
12. The Wall Street Journal, July 16, 2021
13. Bloomberg.com, July 15, 2021
14. CNBC.com, July 20, 2021
15. CNBC.com, July 22, 2021
16. CNBC.com, July 26, 2021
17. The Wall Street Journal, July 13, 2021
18. The Wall Street Journal, July 27, 2021
19. The Wall Street Journal, July 28, 2021
20. FederalReserve.gov, July 28, 2021