Freedom Capital Management February Market Update (Click for full article)

February 8, 2021
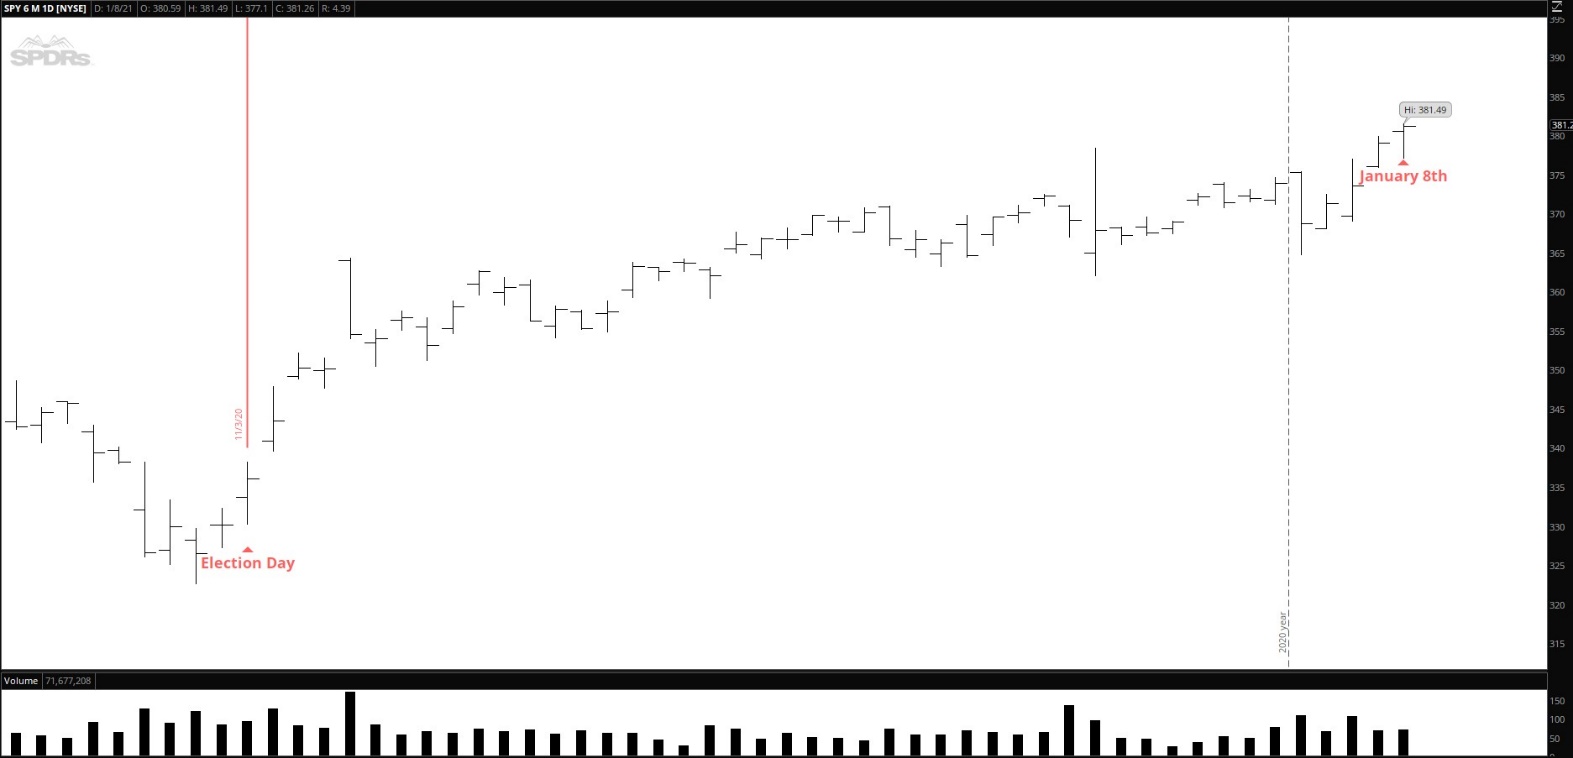
The Markets continue higher with three more weeks of quarterly earnings reports. Neither a virus, nor politics, can stop the markets from making from new highs. As reported by FactSet, overall, 59% of the companies in the S&P 500 have reported actual results for Q4 2020 to date. Of these companies, 81% have reported actual EPS above estimates, which is above the five-year average of 74%. If 81% is the final percentage for the quarter, it will tie the mark for the second-highest percentage of S&P 500 companies reporting a positive EPS surprise since FactSet began tracking this metric in 2008. In aggregate, companies are reporting earnings that are 15.2% above the estimates, which is also above the five-year average of 6.3%. If 15.2% is the final percentage for the quarter, it will mark the third-largest earnings surprise percentage reported by the index since FactSet began tracking this metric in 2008.
Last week Congress passed a measure to bring President Biden’s $1.9 trillion relief package closer to passage into law. Friday, on a strict party-line 51-50 vote in the Senate (all 50 members of the GOP voted “no” while all 50 Democrats voted “yes,” with Democratic Vice President Harris casting the tiebreaker), the measure brought the initial $1.9 trillion almost completely intact: additional $1400 stimulus checks, increases to child tax credits, and extensions to pandemic-related unemployment benefits, among other things.
There was some market manipulation that took place over the last 4 weeks and it was blamed on retail investors and the social media site called Reddit. To explain Short Selling, I have modified this article written by Jared Blikre at Yahoo finance.
In a typical rally, large institutional investors purchase stock during an accumulation phase. A catalyst, such as an earnings release, sets the stage for a breakout due to increased interest and demand. In a short squeeze, the dynamics are a bit different. Large institutional investors are short the stock, and the resulting stock price can be much more violent due to supply and demand.
To short a stock, a hedge fund or trader sells a stock at a high price only to hope to buy it back at a lower price. The opposite of the accumulation phase. (During the Global Financial Crisis in 2008 regulators banned short selling with the hope of mitigating the fallout of a major sell-off). Once the price starts increasing in a heavily shorted stock, the short sellers are forced to cover their positions and buy the shorted stock at higher prices than they were trying to sell it at. This buying further drives up the price, which is often exacerbated by borrowing costs and margin rates increasing. If the stock price surges too much for the short hands to hold, shares can skyrocket with the stock going parabolic. These dramatic moves are easy to identify on a chart as a “short squeeze.”
There are a number of reasons why the recent spate of short squeezes were unlike anything Wall Street has seen before. First, retail buyers now constitute an increasing percentage of the market, as much as 25%, up from only 10% in 2019. Due to the magnitude of the short squeezes, primarily concentrated in names held by retail traders, another factor called counterparty risk added more uncertain volatility. The brokers, where the stocks are held, are on the hook for any unrealized profits and losses in the meantime. In addition, some hedge funds, who were short the stocks, were forced to take in new money to shore up their balance sheets after sustaining dramatic losses. Other brokers eliminated or lowered the ability to trade on margin requiring positions to be 100% funded. While this is perfectly normal and routine for brokers given the increased risk from their customers, this rankled new investors who accused brokers of colluding with the short sellers.
The recent stock manipulation phenomenon will be studied by market technicians and historians. In the future, an investor looking up “short squeeze” in the dictionary might see a chart of GameStop, “GME” which was one of the short squeeze stocks.
The VIX Index closed on Friday at 20.87. The VIX Index has fallen for the last 11 days. A falling VIX is bullish for the markets. I prefer a VIX below 20 and a VIX below 15 is even more bullish.
Percent of stocks above their 50 day and 200 day moving average. 73% of stocks are above their 50-day moving average, lower than last month, and 89% of the stocks are above their 200-day moving average. When 60% of stocks are above their 200-day moving average, as they are now, that is bullish.
Federal Reserve: The next FOMC meeting announcement is on March 17. On January 27, the Federal Reserve voted to maintain the current interest rate at a range of 0% to 0.25%
Unemployment Rate: The unemployment rate fell by 0.4 percentage point to 6.3 percent in January, while nonfarm payroll employment changed little (+49,000), the U.S. Bureau of Labor Statistics reported February 5th. The labor market continued to reflect the impact of the coronavirus (COVID-19) pandemic and efforts to contain it. In January, notable job gains in professional and business services and in both public and private education were offset by losses in leisure and hospitality, in retail trade, in health care, and in transportation and warehousing.
Inflation Rate: The annual inflation rate for the United States is 1.4% for the 12 months ended December 2020 as compared to 1.2% previously, according to U.S. Labor Department data published on January 13, 2021.
Overall, the market is continuing to show strength. As earnings seasons continues we will be watching to see if the market volatility increases or decreases.
To view past Market Newsletters, go to www.freedomcapitalmanagement.com and on the home page you will see recent newsletters and for older newsletters go to the blog page tab at the top of the home page.
______________________________________________________________________
In this month’s recap: As the month came to a close, stocks were mixed as attention shifted to unprecedented activity around a handful of companies with short-interest positions.
Monthly Economic Update

Presented by Guy Woolley, February 2021
U.S. Markets
Stocks were mixed in January, giving up much of the month’s gains in the final days of trading, as unprecedented activity in a handful of companies roiled markets.
The Dow Jones Industrial Average dropped 2.04 percent and the Standard & Poor’s 500 Index fell 1.11 percent. By contrast, the Nasdaq Composite gained 1.42 percent.1
Mixed Signals
The stock market stumbled at the start of the month, retreating amid the slow pace of vaccine distribution and concerns that the economic recovery might take longer than anticipated.
However, stocks regained some upside momentum on news of strong manufacturing data, firmer oil prices, and hopes for an additional fiscal stimulus.
“Act Big,” Says Yellen
After touching record highs, stocks drifted lower again, weighed down by rising interest rates, which caused some concerns over current stock valuations.
Market sentiment improved after testimony from incoming Treasury Secretary Janet Yellen to the Senate Finance Committee that lawmakers needed to “act big” on fiscal stimulus, thereby raising hopes for substantial federal spending.
Earnings Season
Investor enthusiasm was further supported by a strong start to the fourth-quarter earnings season. With 37 percent of the S&P 500 index companies reporting at month-end, 82 percent reported a positive earnings surprise.
Nonetheless, quarterly reports haven’t always translated into higher stock prices. In fact, the share prices of the companies that reported positive earnings surprises fell an average of 1.2 percent in the two days preceding and following the earnings release.2,3,4
Lesson in Short Selling
Stocks closed the month on a volatile note as many retail investors were introduced to the concept of short selling and how it can influence a stock’s price. This unexpected buying activity roiled markets and fueled a sharp rise in several stocks.
To sell short, investors are required to open a margin account. Selling short is not suitable for everyone, as margin trading entails greater risk, including the risk of unlimited losses in a position and the incurrence of margin interest debt. You should consider your financial situation and risk tolerance before trading on margin.
Sector Scorecard
Sectors were also mixed, with Energy (+3.75 percent), Health Care (+1.4 percent), Consumer Discretionary (+0.77 percent) and Real Estate (+0.55 percent) posting gains. Consumer Staples (-4.98 percent), Industrials (-4.27 percent), Materials (-2.42 percent), Communication Services (-0.89 percent), Financials (-1.8 percent), Technology (-0.84 percent), and Utilities (-0.88 percent) closed lower.5
What Investors May Be Talking About in February
In the month ahead, expect President Biden to continue outlining his agenda. A newly elected president’s first 100 days often set the tone for the next four years.
Investors will be looking at his initial priorities as well as how he and Congress will work together. Policy changes can sometimes introduce uncertainty into the markets even as companies wait to learn of new businesses and investment incentives.

T I P O F T H E M O N T H

At a 4% rate of inflation, expenses will double every 18 years. That’s a pretty good argument for growth investing in retirement.

World Markets
Overseas markets were mixed at the start of the year, with the MSCI-EAFE Index gaining 0.56 percent.6
In Europe, France lost 2.74 percent while the United Kingdom slipped 0.82 percent. Germany provided a spark, picking up 5.21 percent.7
The Pacific Rim markets performed better. Hong Kong gained 3.87 percent and Japan added 0.80 percent. Australia tacked on 0.31 percent.8
Indicators
Gross Domestic Product: The nation’s economy grew by 4.0 percent in the fourth quarter. For the full year, GDP dropped 3.5 percent.9
Employment: Total nonfarm payrolls declined by 140,000, led by losses in the hospitality and leisure sectors. The unemployment rate remained steady at 6.7 percent.10
Retail Sales: Retail sales fell 0.7 percent. Excluding motor vehicles and gasoline, consumer purchases fell a more substantial 2.1 percent.11
Industrial Production: Industrial production jumped 1.6 percent, well ahead of consensus estimates of a 0.5 percent increase.12
Housing: Housing starts increased by 5.8 percent, powered by a 12.0 percent jump in single-family homes.13
Existing-home sales reached their highest level in 14 years, with an increase of 0.7 percent in December. Sales were 22 percent higher than in December 2019.14
New home sales rose by 1.6 percent as the median price of new homes surged by 8.0 percent from a year ago.15
Consumer Price Index: Consumer prices rose 0.4 percent in December, driven by an 8.4 percent jump in gasoline prices. The inflation rate for 2020 came in at 1.4 percent.16
Durable Goods Orders: New orders for long-lasting goods increased 0.2 percent. Although it was the eighth straight month of gains, the figure was below expectations, reflecting the general economic softness in December.17

Q U O T E O F T H E M O N T H

“Believe you can and you’re halfway there.”
THEODORE ROOSEVELT

The Fed
Fed officials believe that economic weakening due to the resurgence of COVID-19 cases is temporary. They also noted that despite the hiccups in the vaccine distribution, they would wait and see how the rollout proceeds in the weeks ahead before considering any actions.18
“The Federal Reserve is committed to using its full range of tools to support the U.S. economy in this challenging time, thereby promoting its maximum employment and price stability goals,” Fed officials said in a prepared statement at the conclusion of their two-day meeting on January 27, 2021.19
| MARKET INDEX | Y-T-D CHANGE | January 2020 |
| DJIA | -2.04% | -2.04% |
| NASDAQ | 1.42% | 1.42% |
| S&P 500 | -1.11% | -1.11% |
| BOND YIELD | Y-T-D | March 2020 |
| 10 YR TREASURY | +0.17% | 1.09% |
Sources: Yahoo Finance, January 31, 2021
The market indexes discussed are unmanaged and generally considered representative of their respective markets. Individuals cannot directly invest in unmanaged indexes. Past performance does not guarantee future results. U.S. Treasury Notes are guaranteed by the federal government as to the timely payment of principal and interest. However, if you sell a Treasury Note prior to maturity, it may be worth more or less than the original price paid.

T H E M O N T H L Y R I D D L E

If an electric train is going south and the wind is blowing north, what direction is the smoke going?
LAST MONTH’S RIDDLE: What do the following six words have in common: fast, away, water, through, down, neck?
ANSWER: You can put “break” in front of each of them and make a new word.

Guy Woolley may be reached at 415-236-5364 or guy@freedomcapitalmanagement.com
www.freedomcapitalmanagement.com
Know someone who could use information like this?
Please feel free to send us their contact information via phone or email. (Don’t worry – we’ll request their permission before adding them to our mailing list.)

«RepresentativeEmailDisclosure»
This material was prepared by MarketingPro, Inc., and does not necessarily represent the views of the presenting party, nor their affiliates. The information herein has been derived from sources believed to be accurate. Please note – investing involves risk, and past performance is no guarantee of future results. Investments will fluctuate and when redeemed may be worth more or less than when originally invested. This information should not be construed as investment, tax or legal advice and may not be relied on for the purpose of avoiding any Federal tax penalty. This is neither a solicitation nor recommendation to purchase or sell any investment or insurance product or service, and should not be relied upon as such. All market indices discussed are unmanaged and are not illustrative of any particular investment. Indices do not incur management fees, costs, or expenses. Investors cannot invest directly in indices. All economic and performance data is historical and not indicative of future results. The Dow Jones Industrial Average is a price-weighted index of 30 actively traded blue-chip stocks. The NASDAQ Composite Index is a market-weighted index of all over-the-counter common stocks traded on the National Association of Securities Dealers Automated Quotation System. The Standard & Poor’s 500 (S&P 500) is a market-cap weighted index composed of the common stocks of 500 leading companies in leading industries of the U.S. economy. The Russell 2000 Index measures the performance of the small-cap segment of the U.S. equity universe. The CBOE Volatility Index® (VIX®) is a key measure of market expectations of near-term volatility conveyed by S&P 500 stock index option prices. NYSE Group, Inc. (NYSE:NYX) operates two securities exchanges: the New York Stock Exchange (the “NYSE”) and NYSE Arca (formerly known as the Archipelago Exchange, or ArcaEx®, and the Pacific Exchange). NYSE Group is a leading provider of securities listing, trading and market data products and services. The New York Mercantile Exchange, Inc. (NYMEX) is the world’s largest physical commodity futures exchange and the preeminent trading forum for energy and precious metals, with trading conducted through two divisions – the NYMEX Division, home to the energy, platinum, and palladium markets, and the COMEX Division, on which all other metals trade. The SSE Composite Index is an index of all stocks (A shares and B shares) that are traded at the Shanghai Stock Exchange. The CAC-40 Index is a narrow-based, modified capitalization-weighted index of 40 companies listed on the Paris Bourse. The FTSEurofirst 300 Index comprises the 300 largest companies ranked by market capitalization in the FTSE Developed Europe Index. The FTSE 100 Index is a share index of the 100 companies listed on the London Stock Exchange with the highest market capitalization. Established in January 1980, the All Ordinaries is the oldest index of shares in Australia. It is made up of the share prices for 500 of the largest companies listed on the Australian Securities Exchange. The S&P/TSX Composite Index is an index of the stock (equity) prices of the largest companies on the Toronto Stock Exchange (TSX) as measured by market capitalization. The Hang Seng Index is a free float-adjusted market capitalization-weighted stock market index that is the main indicator of the overall market performance in Hong Kong. The FTSE TWSE Taiwan 50 Index is a capitalization-weighted index of stocks comprising 50 companies listed on the Taiwan Stock Exchange developed by Taiwan Stock Exchange in collaboration with FTSE. The MSCI World Index is a free-float weighted equity index that includes developed world markets and does not include emerging markets. The Mexican Stock Exchange, commonly known as Mexican Bolsa, Mexbol, or BMV, is the only stock exchange in Mexico. The U.S. Dollar Index measures the performance of the U.S. dollar against a basket of six currencies. Additional risks are associated with international investing, such as currency fluctuations, political and economic instability, and differences in accounting standards. This material represents an assessment of the market environment at a specific point in time and is not intended to be a forecast of future events or a guarantee of future results. MarketingPro, Inc. is not affiliated with any person or firm that may be providing this information to you. The publisher is not engaged in rendering legal, accounting, or other professional services. If assistance is needed, the reader is advised to engage the services of a competent professional.
CITATIONS:
1. The Wall Street Journal, January 31, 2021
2. FactSet Research, January 22, 2021. “Earnings Insights.”
3. FactSet Research, January 29, 2021
4. FactSet Research, January 25, 2021
5. FactSet Research, January 31, 2021
6. MSCI.com, January 31, 2020
7. MSCI.com, January 31, 2020
8. MSCI.com, January 31, 2020
9. The Wall Street Journal, January 28, 2021
10. BLS.gov, January 8, 2021
11. The Wall Street Journal, January 15, 2021
12. The Wall Street Journal, January 15, 2021
13. CNBC.com, January 21, 2021
14. The Wall Street Journal, January 22, 2021
15. Reuters.com, January 28, 2021
16. The Wall Street Journal, January 13, 2021
17. The Wall Street Journal, January 27, 2021
18. The Wall Street Journal, January 27, 2021
19. FederalReserve.gov, January 27, 2021