by Guy Woolley | Nov 3, 2020 | Finance

Date: October 10, 2020
As I mentioned last month, “If the trend is broken and selling volume increases, I will trim positions to increase cash in the portfolios.” We were very close to that happening as you can see on the chart below. The orange line is the 50-Day moving average which the market fell below on September 17. It was trading in that area for six days before moving back above the green base line of the upward rising regression channel. The market found support and is now moving higher again. It looks as if it wants to get back to the all-time that the Nasdaq 100 EFT hit at 303.50 on September 2nd before the sell-off. With all that is happening in our country it is surprising that the markets are showing so much continued strength. Could the strength be due to the renewed hope for an additional stimulus package?
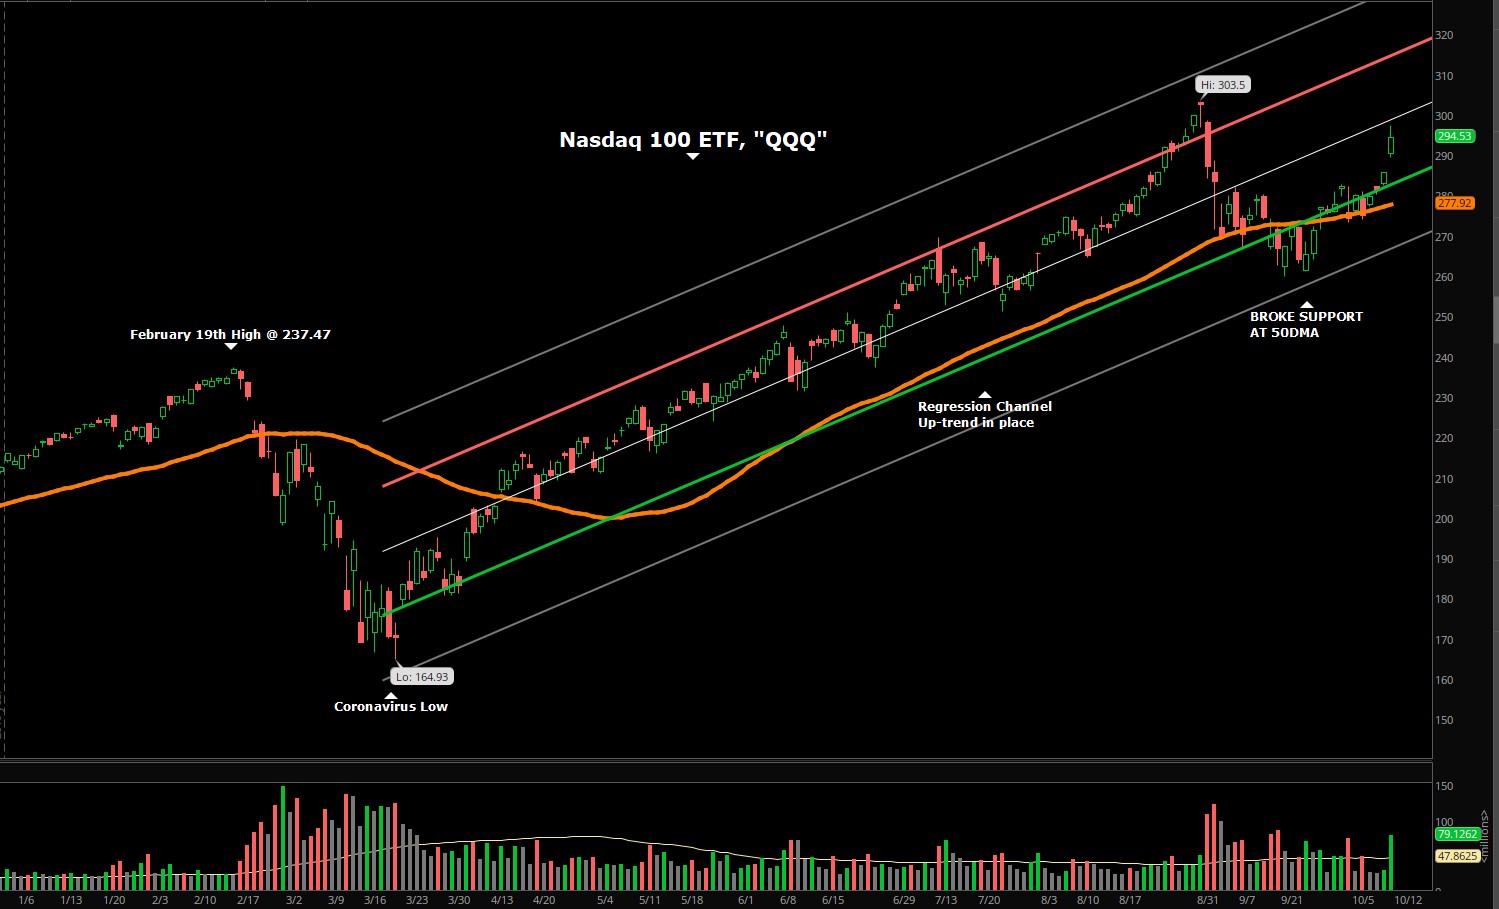
The chart above is of the Nasdaq 100 Exchange Traded Fund, Symbol “QQQ”
The VIX Index closed at 25.00 on Friday, October 9. It is slightly lower than last month. As the VIX declines in value the markets tend to rise. As I mentioned last month, I expect the VIX to stay at higher levels until after the Presidential election.
Percent of stocks above their 50 day and 200 day moving average. 78% of stocks are above their 50-day moving average and 73% of stocks are above their 200-day moving average, which is higher than last month. The confirms the markets gaining strength. When 60% of the stocks are above their 200-day moving average, it is a bullish sign.
Federal Reserve: The next FOMC meeting is November 5, 2020.
Unemployment Rate: Total nonfarm payroll employment rose by 661,000 in September, and the unemployment rate declined to 7.9 percent, the U.S. Bureau of Labor Statistics reported October 2nd. These improvements in the labor market reflect the continued resumption of economic activity that had been curtailed due to the coronavirus (COVID-19) pandemic and efforts to contain it. In September, notable job gains occurred in leisure and hospitality, in retail trade, in health care and social assistance, and in professional and business services. Employment in government declined over the month, mainly in state and local government education.
Inflation Rate: The annual inflation rate for the United States is 1.3% for the 12 months ended August 2020 as compared to 1.0% previously, according to U.S. Labor Department data published on September 11, 2020. The next inflation update is scheduled for release on October 13.
Overall, the markets gained some strength from the recent lows and are looking to move back to the recent highs set in early September.
In this month’s recap: Stocks dropped during the month as investors worried about stalled fiscal stimulus talks in Washington, the upcoming election, and new coronavirus cases in Europe.
Monthly Economic Update

Presented by Guy Woolley, October 2020
U.S. Markets
Stocks dropped in September as investors worried about stalled fiscal stimulus talks in Washington, the upcoming election, and new coronavirus cases in Europe.
The Dow Jones Industrial Average, which lagged this year slipped 2.28 percent. The Standard & Poor’s 500 Index lost 3.92 percent and the Nasdaq Composite declined 5.16 percent.1
Tech Stocks Under Pressure
After a strong rally in August, investor sentiment quickly turned negative as technology stocks dragged down the overall market.
The retreat in the technology sector gathered steam as the month wore on, sending the tech-heavy Nasdaq Composite into correction territory over a three-day span following a recent record high. A correction is defined as a decline of at least 10 percent but not more than 20 percent from a recent high.2
A Few Bright Spots
The month did offer moments of optimism, however, that sparked brief rallies, such as an increase in merger and acquisition deals and further reported progress on a COVID-19 vaccine. However, concerns about the November election, the fading hopes for a fiscal stimulus bill, and an increase in European COVID-19 cases weighed heavily on investor sentiment.
As September came to a close, the market cut its losses, surging on the final two days of trading as legislators appeared to reopen fiscal stimulus talks.
Sector Scorecard
All 11 industry sectors were lower in September, with losses in Communication Services (−6.61 percent), Consumer Discretionary (−3.15 percent), Consumer Staples (−3.71 percent), Energy (−17.56 percent), Financials (−6.35 percent), Health Care (−3.87 percent), Industrials (−2.04 percent), Materials (−1.52 percent), Real Estate (−4.05 percent), Technology (−6.03 percent), and Utilities (−0.37 percent).3
What Investors May Be Talking About in October
The housing sector has been a bright spot in a challenging year and has seen strong consumer demand thanks to historically low interest rates.
Home building and home sales have set new records in recent months, while home builder confidence is at an all-time high. The National Association of Home Builders/Wells Fargo Housing Market Index posted a reading of 83 out of a possible 100 in September, well above its previous record high of 78.4,5
Housing accounts for 15 percent of the nation’s gross domestic product, so investors may watch for the sector to retain its momentum in the fourth quarter and into 2021.6

T I P O F T H E M O N T H

Take a look at what is on your credit report. You are entitled to one free copy from each credit bureau annually. Why not have a look?

World Markets
International markets struggled amid more coronavirus cases in Europe and concerns over the tensions between the U.S. and China.
The MSCI-EAFE Index fell 2.20 percent in September.7
European markets were broadly weaker. France dropped 2.91 percent, Germany lost 1.43 percent, and the U.K. slipped 1.68 percent.8
Pacific Rim stocks were mixed as Australia fell 4.04 percent and Hong Kong declined 6.82 percent. Japan notched a solid gain, tacking on 9.68 percent.9
Indicators
Gross Domestic Product: The final reading of the second-quarter GDP showed an annualized decline of 31.4 percent.10
Employment: The unemployment rate dropped to 8.4 percent as employers added 1.4 million jobs in August.11
Retail Sales: Retail sales growth slowed in August, rising only 0.6 percent as the supplemental unemployment benefits expired at the end of July. The benefits helped buyers in prior months.12
Industrial Production: Industrial output rose 0.4 percent, below economists’ expectations of a 1 percent increase.13
Housing: Housing starts fell 5.1 percent after sharp gains in the previous three months. Single-family home starts increased by 4.1 percent, but the overall result was dragged down by a 22.7 percent decline in multi-family starts.14
Existing home sales rose 2.4 percent from July and were 10.5 percent higher than August of last year.15
Sales of new homes rose to their highest level in almost 14 years, posting a 4.8 percent increase from the previous month.16
Consumer Price Index: Consumer prices jumped 0.4 percent in August, led by the sharpest increase in the cost of used cars and trucks in more than 50 years. On a year-over-year basis, inflation rose 1.3 percent.17
Durable Goods Orders: For the fourth straight month durable goods orders rose, increasing by 0.4 percent in August. New orders for nondefense capital goods, excluding aircraft, jumped 1.8 percent.18

Q U O T E O F T H E M O N T H

“Vision is the art of seeing things that are invisible to others.”
JONATHAN SWIFT

The Fed
The Federal Reserve signaled that interest rates would likely not increase until 2023 following its two-day Federal Open Market Committee (FOMC) meeting that ended on September 16.19
Fed officials also stressed the importance of additional fiscal stimulus.19
Fed officials adjusted their outlook for unemployment, predicting it would average between 7 and 8 percent in the final three months of the year. Previously, Fed officials had expected unemployment of between 9 and 10 percent in the final calendar quarter of 2020.19
|
MARKET INDEX
|
Y-T-D CHANGE
|
September 2020
|
|
DJIA
|
-2.65%
|
-2.28%
|
|
NASDAQ
|
24.46%
|
-5.16%
|
|
S&P 500
|
4.09%
|
-3.92%
|
| |
|
|
|
BOND YIELD
|
Y-T-D
|
September 2020
|
|
10 YR TREASURY
|
-1.24%
|
0.69%
|
Sources: Yahoo Finance, September 30, 2020
Indices are unmanaged, do not incur fees or expenses, and cannot be invested into directly. These returns do not include dividends. 10-year Treasury real yield = projected return on investment, expressed as a percentage, on the U.S. government’s 10-year bond.

T H E M O N T H L Y R I D D L E

What is no sooner spoken than broken?
LAST MONTH’S RIDDLE: Sally promised Kate today that she will tell Kate a big secret on the day before four days from the day after tomorrow. If today is Saturday the 13th, on what day and date will Sally tell Kate her big secret?
ANSWER: Thursday the 18th.

Guy Woolley may be reached at 415-236-5364 or guy@freedomcapitalmanagement.com
www.freedomcapitalmanagement.com
Know someone who could use information like this?
Please feel free to send us their contact information via phone or email. (Don’t worry – we’ll request their permission before adding them to our mailing list.)

«Representative Disclosure»
This material was prepared by MarketingPro, Inc., and does not necessarily represent the views of the presenting party, nor their affiliates. The information herein has been derived from sources believed to be accurate. Please note – investing involves risk, and past performance is no guarantee of future results. Investments will fluctuate and when redeemed may be worth more or less than when originally invested. This information should not be construed as investment, tax or legal advice and may not be relied on for the purpose of avoiding any Federal tax penalty. This is neither a solicitation nor recommendation to purchase or sell any investment or insurance product or service, and should not be relied upon as such. All market indices discussed are unmanaged and are not illustrative of any particular investment. Indices do not incur management fees, costs, or expenses. Investors cannot invest directly in indices. All economic and performance data is historical and not indicative of future results. The Dow Jones Industrial Average is a price-weighted index of 30 actively traded blue-chip stocks. The NASDAQ Composite Index is a market-weighted index of all over-the-counter common stocks traded on the National Association of Securities Dealers Automated Quotation System. The Standard & Poor’s 500 (S&P 500) is a market-cap weighted index composed of the common stocks of 500 leading companies in leading industries of the U.S. economy. The Russell 2000 Index measures the performance of the small-cap segment of the U.S. equity universe. The CBOE Volatility Index® (VIX®) is a key measure of market expectations of near-term volatility conveyed by S&P 500 stock index option prices. NYSE Group, Inc. (NYSE:NYX) operates two securities exchanges: the New York Stock Exchange (the “NYSE”) and NYSE Arca (formerly known as the Archipelago Exchange, or ArcaEx®, and the Pacific Exchange). NYSE Group is a leading provider of securities listing, trading and market data products and services. The New York Mercantile Exchange, Inc. (NYMEX) is the world’s largest physical commodity futures exchange and the preeminent trading forum for energy and precious metals, with trading conducted through two divisions – the NYMEX Division, home to the energy, platinum, and palladium markets, and the COMEX Division, on which all other metals trade. The SSE Composite Index is an index of all stocks (A shares and B shares) that are traded at the Shanghai Stock Exchange. The CAC-40 Index is a narrow-based, modified capitalization-weighted index of 40 companies listed on the Paris Bourse. The FTSEurofirst 300 Index comprises the 300 largest companies ranked by market capitalisation in the FTSE Developed Europe Index. The FTSE 100 Index is a share index of the 100 companies listed on the London Stock Exchange with the highest market capitalization. Established in January 1980, the All Ordinaries is the oldest index of shares in Australia. It is made up of the share prices for 500 of the largest companies listed on the Australian Securities Exchange. The S&P/TSX Composite Index is an index of the stock (equity) prices of the largest companies on the Toronto Stock Exchange (TSX) as measured by market capitalization. The Hang Seng Index is a free float-adjusted market capitalization-weighted stock market index that is the main indicator of the overall market performance in Hong Kong. The FTSE TWSE Taiwan 50 Index is a capitalization-weighted index of stocks comprises 50 companies listed on the Taiwan Stock Exchange developed by Taiwan Stock Exchange in collaboration with FTSE. The MSCI World Index is a free-float weighted equity index that includes developed world markets and does not include emerging markets. The Mexican Stock Exchange, commonly known as Mexican Bolsa, Mexbol, or BMV, is the only stock exchange in Mexico. The U.S. Dollar Index measures the performance of the U.S. dollar against a basket of six currencies. Additional risks are associated with international investing, such as currency fluctuations, political and economic instability and differences in accounting standards. This material represents an assessment of the market environment at a specific point in time and is not intended to be a forecast of future events, or a guarantee of future results. MarketingPro, Inc. is not affiliated with any person or firm that may be providing this information to you. The publisher is not engaged in rendering legal, accounting or other professional services. If assistance is needed, the reader is advised to engage the services of a competent professional.
CITATIONS:
1. The Wall Street Journal, September 30, 2020
2. MarketWatch.com, September 12, 2020
3. FastSet Research, September 30, 2020
4. CNBC.com, September 22, 2020
5. EyeOnHousing.com, September 16, 2020
6. Federation of American Scientists, October 2, 2019
7. MSCI.com, September 30, 2020
8. MSCI.com, September 30, 2020
9. MSCI.com, September 30, 2020
10. CNBC.com, September 30, 2020
11. The Wall Street Journal, September 4, 2020
12. The Wall Street Journal, September 16, 2020
13. The Wall Street Journal, September 15, 2020
14. CNBC.com, September 17, 2020
15. CNBC.com, September22, 2020
16. CNBC.com, September 24, 2020
17. CNBC.com, September 11, 2020
18. The Wall Street Journal, September 25, 2020
19. The Wall Street Journal, September 16, 2020
by Guy Woolley | Nov 3, 2020 | Finance

Date: September 12, 2020
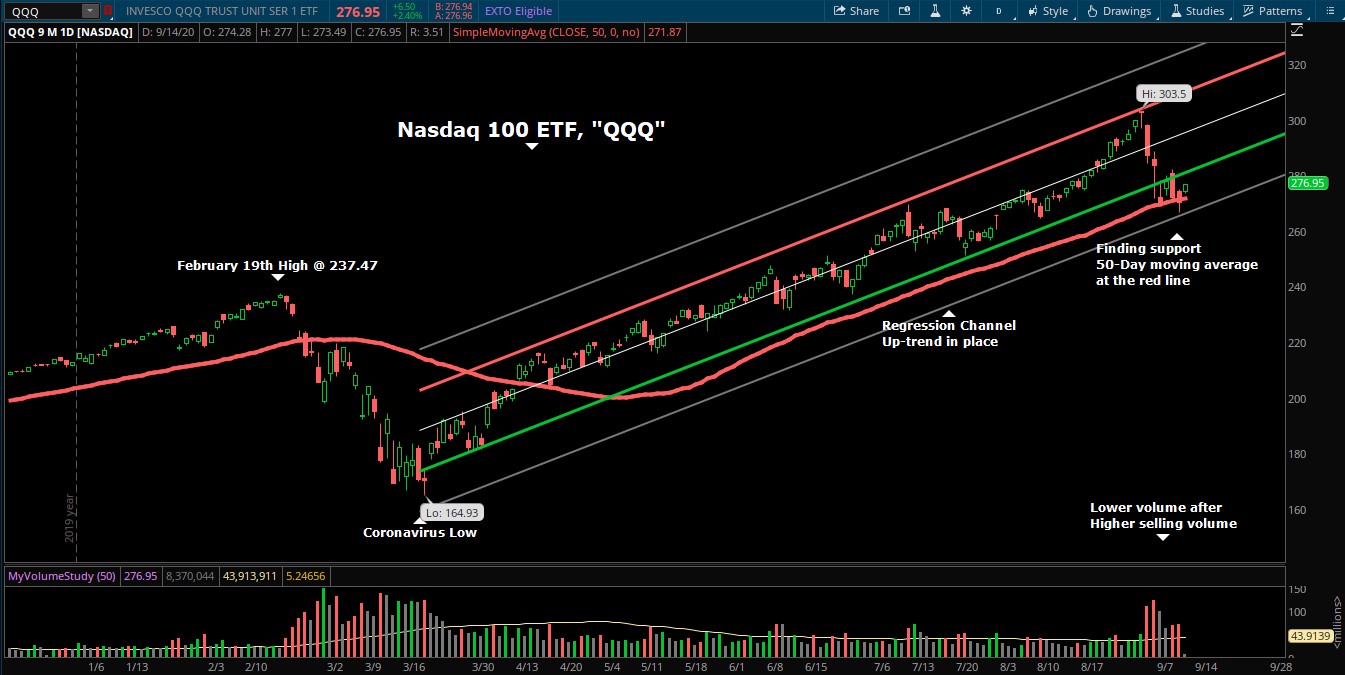
The NASDAQ 100, which is tracked buy the Exchange Traded Fund symbol QQQ, hit an all-time high at 303.50 on September 2nd. Since then it has declined 11% as of Friday’s close. The run up to the highs was very strong. But what happens now? As you can see on the chart below the Nasdaq 100 is still in an uptrend but sitting at the bottom of the channel it has been trading within for the 6 months. One good thing to see is volume declining. This indicates that traders are not increasing their selling as the market falls, which could create an area of price acceptance and stabilization. If we do break below the trendline I would expect volume to increase and additional selling to the next support area near the 250 mark. Since the Nasdaq 100 has risen over 60% since February 19th at the Coronavirus low, I would consider this correction a normal pull back. If the trend is broken and selling volume increases, I will trim positions to increase cash in the portfolios. The Volatility Index continues to remain higher than normal and I expect it will stay above average levels at least until after the Presidential election. Volatility provides a gauge of market risk and measure of uncertainty in the markets.
The VIX Index closed at 26.87 on Friday, Sept 11. It has been as high as 38 on Sept 4th when the selling began. As I mentioned above, I expect this to stay at higher levels until after the Presidential election.
Percent of stocks above their 50 day and 200 day moving average. 53% of stocks are above their 50-day moving average and 58% of stocks are above their 200-day moving average, which is lower than last month. 60% of stocks above their 200-day moving average is bullish.
Federal Reserve: The next FOMC meeting is this week on September 16, 2020.
Unemployment Rate: Total nonfarm payroll employment rose by 1.4 million in August, and the unemployment rate fell to 8.4 percent, the U.S. Bureau of Labor Statistics reported September 4th. These improvements in the labor market reflect the continued resumption of economic activity that had been curtailed due to the coronavirus (COVID-19) pandemic and efforts to contain it. In August, an increase in government employment largely reflected temporary hiring for the 2020 Census. Notable job gains also occurred in retail trade, in professional and business services, in leisure and hospitality, and in education and health services.
Inflation Rate: The annual inflation rate for the United States is 1.3% for the 12 months ended August 2020 as compared to 1.0% previously, according to U.S. Labor Department data published on September 11, 2020.
Overall, the markets have pulled back from their recent highs, which at this time seems normal.
In this month’s recap: Stocks prices surged in August as investors cheered positive news of a potential COVID-19 treatment and welcomed a month-long succession of upbeat economic data.
Monthly Economic Update

Presented by Guy Woolley, September 2020
U.S. Markets
Stock prices surged in August as investors cheered positive news of a potential COVID-19 treatment and welcomed a month-long succession of upbeat economic data.
The Dow Jones Industrial Average rose 7.57 percent, the Standard & Poor’s 500 Index climbed 7.01 percent, and the Nasdaq Composite soared 9.59 percent.1
Solid Foundation
The month’s foundation was set by a series of strong economic reports, including an increase in manufacturing activity, better-than-anticipated factory orders, and a lessening of new jobless claims.2,3,4
Notching Highs
The S&P 500 index finally broke through resistance, ending the third week of August at a record high and completing the fastest bear market recovery in history. The Nasdaq Composite, having set multiple record highs during the same week, also ended the month at a record high.5,6
Strong Close to the Month
The final full week of trading was remarkable. Investors were encouraged by news of a potential COVID-19 treatment and a report suggesting U.S. and China negotiators had met to discuss trade issues. Stocks pushed higher still following announcement of the Fed’s inflation policy shift, suggesting that interest rates may remain low for longer than expected.
Sector Scorecard
The majority of industry sectors closed higher in August, with gains in Communication Services (+12.02 percent), Consumer Discretionary (+11.48 percent), Consumer Staples (+4.95 percent), Financials (+5.62 percent), Health Care (+2.11 percent), Industrials (+9.98 percent), Materials (+4.89 percent), Real Estate (+1.81 percent), and Technology (+16.62 percent). Energy (-1.27 percent) and Utilities (-2.28 percent) lost ground.7
What Investors May Be Talking About in September
The election season is moving into high gear as November draws near. Will uncertainty about the elections be reflected in the stock market?
Since 1992, the S&P 500 has lost an average of 2 percent in the three months leading up to the presidential election but has been higher 43 percent of the time.8
Keep in mind that the 2 percent average includes the 20 percent drop prior to the 2008 election that was the result of the ongoing credit crisis.9
While past performance is no guarantee of future results, the lesson may be evident: Prepare for some short-term volatility, without losing sight of your overall investment strategy.

T I P O F T H E M O N T H

If you have a son or daughter graduating from college next year, remind them to try and build an emergency fund. Those with the least seniority can be the first to be laid off in the workplace, and sometimes that first job after college doesn’t work out.

World Markets
Markets overseas generally trended higher with the MSCI-EAFE Index rising 4.98 percent in August.10
European markets rose in hopes of a COVID-19 vaccine and another round of economic stimulus. Major markets ended higher, with France gaining 3.42 percent and Germany advancing 5.13 percent. The U.K. lagged a bit, tacking on just 0.70 percent.11
Pacific Rim stocks turned higher, with Australia picking up 2.24 percent and Hong Kong climbing 2.37 percent. Japan had a strong showing, adding 6.59 percent.12
Indicators
Gross Domestic Product: Second-quarter GDP contraction was revised from 32.9 percent to 31.7 percent.13
Employment: The labor market continued to improve, albeit at a slower pace. Employers added 1.8 million jobs in July, and the unemployment rate fell to 10.2 percent.14
Retail Sales: Consumer spending rose a lower-than-expected 1.2 percent in July. Slower sales of electronics and appliances were offset by an increase in restaurant and bar sales.15
Industrial Production: Output by the nation’s manufacturers, miners, and utilities rose 3.0 percent. To put that number in perspective, industrial production hit 8.4 percent in February.16
Housing: Housing starts surged in July, increasing by 22.6 percent.17
Existing home sales soared 24.7 percent, representing the biggest monthly gain since 1968, when tracking of existing home sales began.18
New home sales jumped by 13.9 percent, reaching their highest level in over 13 years.19
Consumer Price Index: Prices of consumer goods rose 0.6 percent in July, with gasoline prices contributing to the increase.20
Durable Goods Orders: Orders for products designed to last three years or longer gained 11.3 percent, rising for the third consecutive month, as defense aircraft and motor vehicle orders led the way.21

Q U O T E O F T H E M O N T H

“You’ve got to get up every morning with determination if you are going to go to bed with satisfaction.”
GEORGE LORIMER

The Fed
Minutes from July’s meeting were released on August 19.
The Federal Open Market Committee (FOMC) appeared to favor more monetary accommodation, though Fed officials were unclear as to the timing or triggers for taking further policy action.
In a prepared statement, the FOMC said, “The path of the economy would depend significantly on the course of the virus.”
In addition, FOMC members believe that the “…ongoing public health crisis would weigh heavily on economic activity, employment, and inflation in the near term…” causing members to maintain the target range for the federal funds rate at 0 to ¼ percent.22
| MARKET INDEX |
Y-T-D CHANGE |
August 2020 |
| DJIA |
-0.38% |
7.57% |
| NASDAQ |
31.24% |
9.59% |
| S&P 500 |
8.34% |
7.01% |
|
|
|
| BOND YIELD |
Y-T-D |
August 2020 |
| 10 YR TREASURY |
-1.23% |
0.69% |
Sources: Yahoo Finance, August 31, 2020
The market indexes discussed are unmanaged and generally considered representative of their respective markets. Individuals cannot directly invest in unmanaged indexes. Past performance does not guarantee future results. U.S. Treasury Notes are guaranteed by the federal government as to the timely payment of principal and interest. However, if you sell a Treasury Note prior to maturity, it may be worth more or less than the original price paid.

T H E M O N T H L Y R I D D L E

Sally promised Kate today that she will tell Kate a big secret on the day before four days from the day after tomorrow. If today is Saturday the 13th, on what day and date will Sally tell Kate her big secret?
LAST MONTH’S RIDDLE: How is it possible to name three consecutive days without using the words Monday, Tuesday, Wednesday, Thursday, Friday, Saturday, or Sunday?
ANSWER: Yesterday, today, and tomorrow.

Guy Woolley may be reached at 415-236-5364 or guy@freedomcapitalmanagement.com
www.freedomcapitalmanagement.com
Know someone who could use information like this?
Please feel free to send us their contact information via phone or email. (Don’t worry – we’ll request their permission before adding them to our mailing list.)

Disclosure
This material was prepared by MarketingPro, Inc., and does not necessarily represent the views of the presenting party, nor their affiliates. The information herein has been derived from sources believed to be accurate. Please note – investing involves risk, and past performance is no guarantee of future results. Investments will fluctuate and when redeemed may be worth more or less than when originally invested. This information should not be construed as investment, tax or legal advice and may not be relied on for the purpose of avoiding any Federal tax penalty. This is neither a solicitation nor recommendation to purchase or sell any investment or insurance product or service, and should not be relied upon as such. All market indices discussed are unmanaged and are not illustrative of any particular investment. Indices do not incur management fees, costs, or expenses. Investors cannot invest directly in indices. All economic and performance data is historical and not indicative of future results. The Dow Jones Industrial Average is a price-weighted index of 30 actively traded blue-chip stocks. The Nasdaq Composite Index is a market-weighted index of all over-the-counter common stocks traded on the National Association of Securities Dealers Automated Quotation System. The Standard & Poor’s 500 (S&P 500) is a market-cap weighted index composed of the common stocks of 500 leading companies in leading industries of the U.S. economy. The Russell 2000 Index measures the performance of the small-cap segment of the U.S. equity universe. The CBOE Volatility Index® (VIX®) is a key measure of market expectations of near-term volatility conveyed by S&P 500 stock index option prices. NYSE Group, Inc. (NYSE:NYX) operates two securities exchanges: the New York Stock Exchange (the “NYSE”) and NYSE Arca (formerly known as the Archipelago Exchange, or ArcaEx®, and the Pacific Exchange). NYSE Group is a leading provider of securities listing, trading and market data products and services. The New York Mercantile Exchange, Inc. (NYMEX) is the world’s largest physical commodity futures exchange and the preeminent trading forum for energy and precious metals, with trading conducted through two divisions – the NYMEX Division, home to the energy, platinum, and palladium markets, and the COMEX Division, on which all other metals trade. The SSE Composite Index is an index of all stocks (A shares and B shares) that are traded at the Shanghai Stock Exchange. The CAC-40 Index is a narrow-based, modified capitalization-weighted index of 40 companies listed on the Paris Bourse. The FTSEurofirst 300 Index comprises the 300 largest companies ranked by market capitalisation in the FTSE Developed Europe Index. The FTSE 100 Index is a share index of the 100 companies listed on the London Stock Exchange with the highest market capitalization. Established in January 1980, the All Ordinaries is the oldest index of shares in Australia. It is made up of the share prices for 500 of the largest companies listed on the Australian Securities Exchange. The S&P/TSX Composite Index is an index of the stock (equity) prices of the largest companies on the Toronto Stock Exchange (TSX) as measured by market capitalization. The Hang Seng Index is a free float-adjusted market capitalization-weighted stock market index that is the main indicator of the overall market performance in Hong Kong. The FTSE TWSE Taiwan 50 Index is a capitalization-weighted index of stocks comprises 50 companies listed on the Taiwan Stock Exchange developed by Taiwan Stock Exchange in collaboration with FTSE. The MSCI World Index is a free-float weighted equity index that includes developed world markets and does not include emerging markets. The Mexican Stock Exchange, commonly known as Mexican Bolsa, Mexbol, or BMV, is the only stock exchange in Mexico. The U.S. Dollar Index measures the performance of the U.S. dollar against a basket of six currencies. Additional risks are associated with international investing, such as currency fluctuations, political and economic instability and differences in accounting standards. This material represents an assessment of the market environment at a specific point in time and is not intended to be a forecast of future events, or a guarantee of future results. MarketingPro, Inc. is not affiliated with any person or firm that may be providing this information to you. The publisher is not engaged in rendering legal, accounting or other professional services. If assistance is needed, the reader is advised to engage the services of a competent professional.
CITATIONS:
1. The Wall Street Journal, August 31, 2020
2. Barrons.com, August 6, 2020
3. MarketWatch, August 3, 2020
4. MarketWatch, August 27, 2020
5. The Wall Street Journal, August 18, 2020
6. The Wall Street Journal, August 31, 2020
7. FastSet Research, August 31, 2020
8. CNBC.com, August 10, 2020
9. CNBC.com, August 10, 2020
10. MSCI.com, August 31, 2020
11. MSCI.com, August 31, 2020
12. MSCI.com, August 31, 2020
13. CNBC.com, August 27, 2020
14. The Wall Street Journal, August 7, 2020
15. CNBC.com, August 14, 2020
16. APNews.com, August 14, 2020
17. CNBC.com, August 18, 2020
18. The Wall Street Journal, August 21, 2020
19. FoxBusiness.com, August 25, 2020
20. The Wall Street Journal, August 12, 2020
21. The Wall Street Journal, August 26, 2020
22. The Wall Street Journal, August 19, 2020