
July 10, 2023
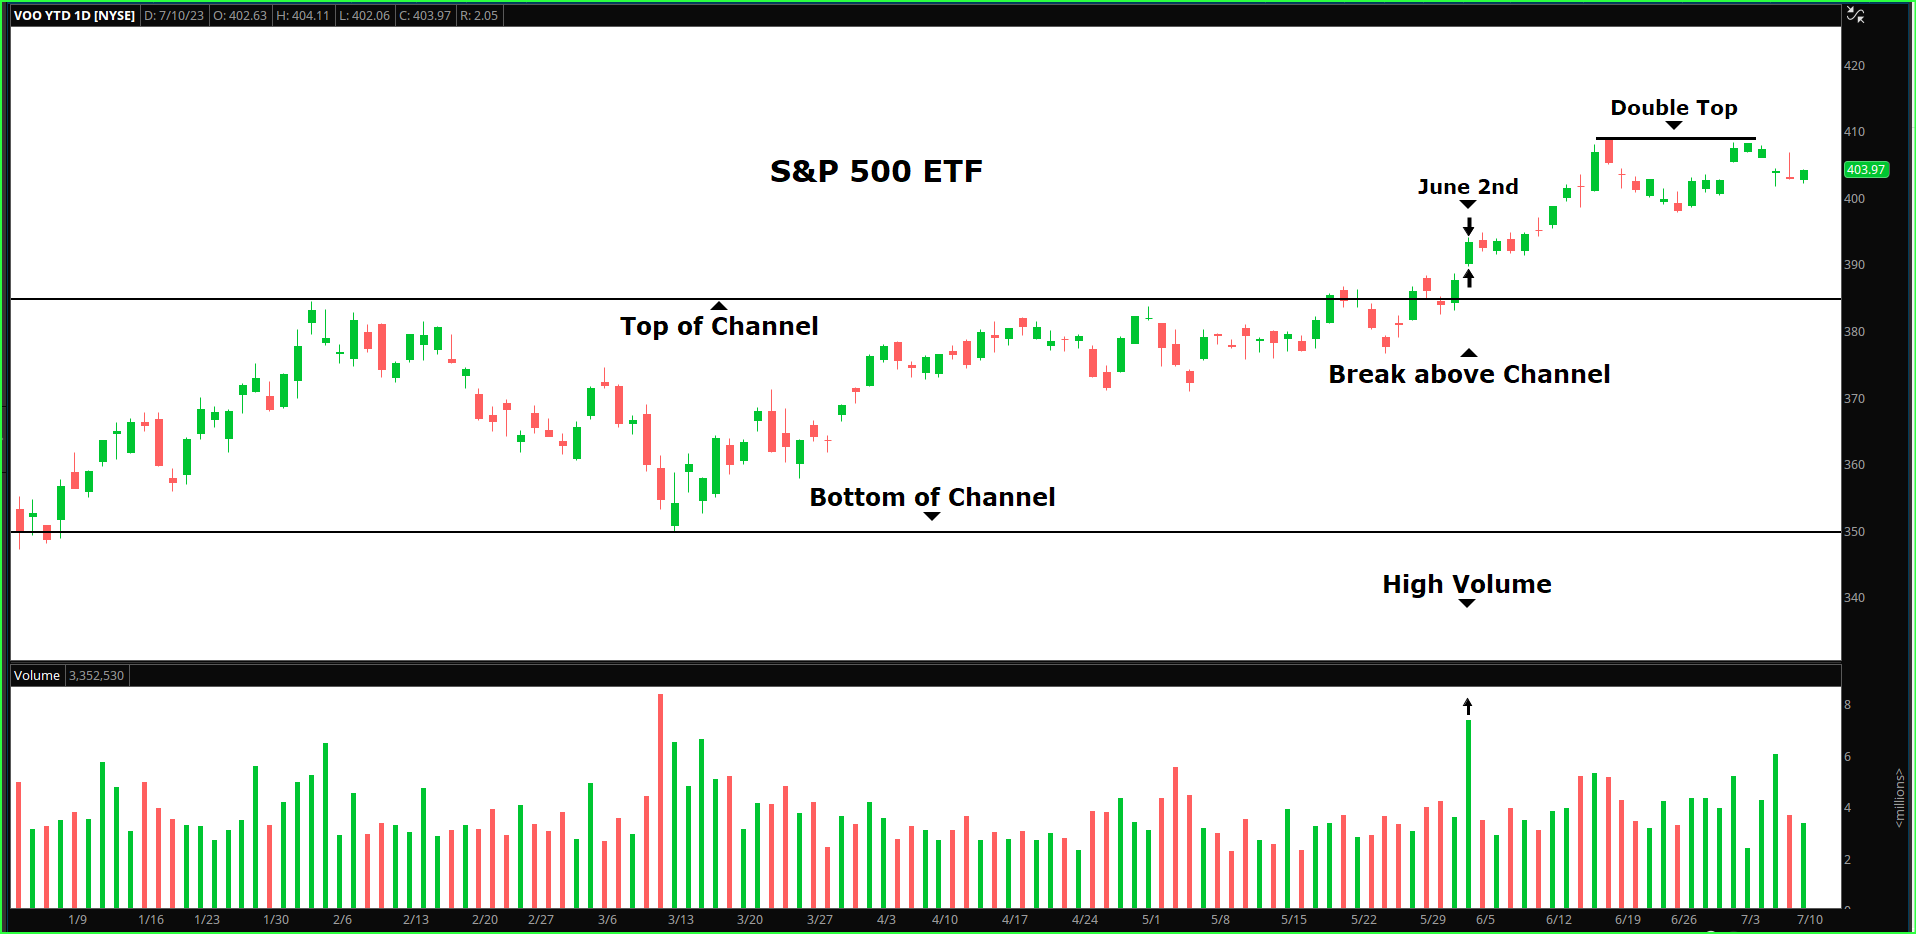
Below is the 2023 year-to-date chart of the exchange-traded fund, symbol VOO, which tracks the S&P 500 Index. The left side of the chart starts on January 3, 2023, and ends today July 10th. Note since the beginning of the year the S&P 500 has been in a channel marked by the two black horizontal lines that run across the chart. On June 2nd the S&P 500 broke above the top of the channel, which would be considered resistance, on high volume that was 216% above average volume, which is marked on the chart. The high volume on the breakout demonstrates that investors and traders were aware of the channel being broken and wanted to add to, or initiate positions. The S&P 500 has climbed from the breakout and now has formed a double top. The double top is a technical pattern that indicates that some traders were willing to take profits at that price. Double tops can be an area where the market will pull back from and then form a consolidation before moving higher or can be a resistance area where each time we get to that price level more traders sell to protect their profits. Only time will tell.
As far as market news, next week will be the start of quarterly earnings announcements. Which are always interesting to see how the reports move the markets. Also, we will get inflation information regarding the Consumer Price Index (CPI) and the Producer Price Index (PPI) reports. Then on July 26, there will be another FOMC meeting, and as of today, there is a 93% expectation that the Federal Reserve will be raising rates another 1/4%, according to the CME FedWatch Tool.
The channel breakout above was very constructive for the markets. Going forward hopefully the markets will stay above the channel and continue to advance.
The VIX Index: On Friday the VIX index closed at 14.83. On 5/1 the VIX was at 15.65. A low VIX number, below 20, is generally bullish for the markets.
Percent of stocks above their 50-day and 200-day moving average: On 6/1, 35% of stocks were above their 50-day moving average, today 73% are above their 50-day moving average. Last month 35% of the stocks were above their 200-day moving average, today 64% are above their 200-day moving average. These numbers are stronger than last month which confirms the market strengthening from last month.
Federal Reserve: The next Federal Reserve announcement will be on Wednesday, July 26. The CME FedWatch Tool at this time is predicting a 93% chance the Federal Reserve will be raising interest rates another ¼%.
Employment Rate: Total nonfarm payroll employment increased by 209,000 in June, and the unemployment rate changed little at 3.6 percent, the U.S. Bureau of Labor Statistics reported on July 7th. Employment continued to trend up in government, health care, social assistance, and construction.
Inflation Rate: The annual inflation rate for the United States was 4.0% for the 12 months ended May, according to U.S. Labor Department data published on June 13, 2023. This follows a rise of 4.9% in the previous period. The next update on inflation is scheduled for release on July 12 at 8:30 a.m. ET. It will provide information on the rate of inflation for the 12 months ending June 2023.
The 10-year Treasury index yield: The rate today is at 4.06%. On June 1st it closed at 3.61%. The intra-day high so far for this year was on March 2nd at 4.09%.
To view past Market Newsletters, go to www.freedomcapitalmanagement.com. On the home page are recent newsletters, for older newsletters go to the blog page tab at the top of the home page.