

September 11, 2022 – [Never forget 9/11/2001]
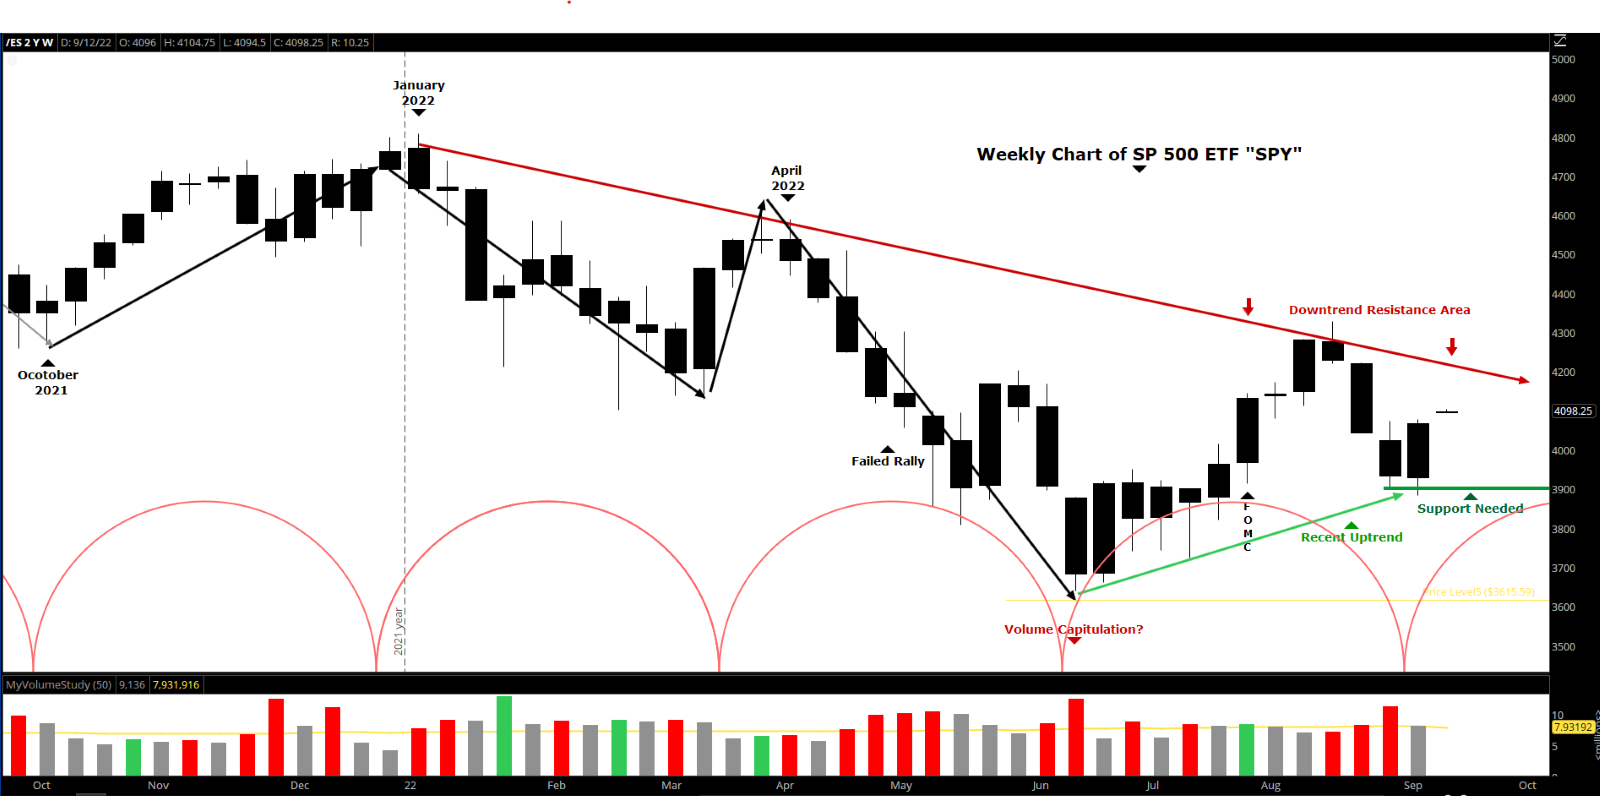
Another uptrend in a down-trending market. Below is the weekly chart of the S&P 500 beginning in October 2021. Since January the market has been in a downtrend as indicated by the red downtrend line above the price bars. We have had bounces in this downtrend but none of the uptrends have broken above the red downtrend line. I wrote about this Zig Zag pattern in a previous newsletter. The downtrend line is the resistance the market needs to break above. Now the market has been in a slight uptrend which started during the week of 6/13 as indicated by the green uptrend line below the price bars. If the market can stay above this uptrend line it will begin to build confidence in the overall market sentiment. Furthermore, if the S&P 500 can break above the red downtrend line and stay above it for some time I believe buying volume will increase. I believe going forward the market may be held back because of the FOMC meeting will be taking place 10 days from today, September 21st. As of this week, according to the CME FedWatch tool, there is a 90% chance that interest rates will be raised ¾% again. The Federal Reserve is aggressively trying to tame inflation.
Some good news for the economy: Gasoline prices at the pump are decreasing and inventory at grocery stores is increasing.
The VIX Index closed Friday at 22.79 after a recent high of 27.80 on 9/6. On August 1st it closed at 22.84. A falling VIX is normally bullish for the markets. I prefer the VIX below 20 and a VIX below 15 is more bullish.
Percent of stocks above their 50-day and 200-day moving average: On 8/1 only 74% of stocks were above their 50-day moving average, today 64% are above their 50-day moving average. Last month 32% of the stocks were above their 200-day moving average, today 36% are above their 200-day moving average. The 50-day is has been rising since the recent low of 34% on 9/6 and is above the 200-day moving average, which is encouraging. When 60% of stocks are above their 200-day moving average that is very bullish. This indicator is helping to confirm the market’s recent rise over the last few days but is not what I would call “bullish.”.
Federal Reserve: On July 27th the Federal Reserve approved a ¾ percentage point increase in the primary credit rate to 2.5 percent. The next FOMC meeting announcement will be Wednesday, September 21st. The CME FedWatch Tool is predicting a 90% chance of another ¾ percentage increase.
Employment Rate: Total nonfarm payroll employment increased by 315,000 in August, and the unemployment rate rose to 3.7 percent, the U.S. Bureau of Labor Statistics reported on Friday, September 2nd. Notable job gains occurred in professional and business services, health care, and retail trade.
Inflation Rate: The annual inflation rate for the United States is 8.5% for the 12 months ended July 2022 after rising 9.1% previously — the most since November 1981, according to U.S. Labor Department data published Aug. 10. The next inflation update is scheduled for release on Sept. 13 at 8:30 a.m. ET. It will offer the rate of inflation over the 12 months that ended August 2022.
The 10-year Treasury index yield: The rate today is at 3.32%. On August 1st it was at 2.84%. The high so far for this year was on 6/14 at 3.48.
To view past Market Newsletters, go to www.freedomcapitalmanagement.com on the home page you will see recent newsletters and for older newsletters go to the blog page tab at the top of the home page.
In this month’s recap: Stocks dropped on renewed fears of higher rates and economic weakening, coupled with some tough talk by the Fed chair.
Monthly Economic Update
![]()
Presented by Guy Woolley, September 2022
U.S. Markets
Renewed fears of higher rates and economic weakening, coupled with a tough talk by Fed Chair Jerome Powell and other Fed officials, sent stocks lower in August.
The Dow Jones Industrial Average dropped 4.06 percent whereas the Standard & Poor’s 500 Index fell 4.24 percent. The Nasdaq Composite lost 4.64 percent.1
A Strong Start
August started off well enough, building on the summer rally over the course of the month’s first two weeks. Investor sentiment was lifted by a surprisingly strong employment report that saw the economy add 528,000 jobs in July and later by a better-than-expected Consumer Price Index (CPI) report that saw inflation decelerate slightly.2,3
Earnings Update
A fresh batch of positive earnings surprises provided an additional boost for stocks. Overall, the earnings season turned out to be better than what many investors had expected. With 97 percent of the companies comprising the S&P 500 reporting, 78 percent reported earnings that exceeded Wall Street analysts’ estimates.4
The fuel for the stock market’s rebound since the mid-June low was, in part, the belief that the Fed may ease up on the pace and magnitude of interest rate hikes owing to early signs that inflation may be cooling.
Powell’s Hammer
But Fed Chair Powell’s much-anticipated speech at the Jackson Hole Economic Symposium rattled investors. By the time Powell finished his speech on the morning of August 26th, the market was in full-on retreat. Powell’s comments did not include anything investors hadn’t already heard, but the forcefulness with which he communicated the Fed’s commitment to lowering inflation struck many investors as especially hawkish.
The market’s month-to-date gains disappeared following the speech as Powell appeared to end any investor hope of a pivot by the Fed. Stocks added to their losses in the month’s final days as investors confronted a monetary policy landscape that potentially offered little relief from further Fed interest rate hikes.
Sector Scorecard
Most industry sectors ended lower for the month, including Communications Services (-3.53 percent), Consumer Discretionary (-4.50 percent), Consumer Staples (-1.85 percent), Financials (-1.96 percent), Health Care (-5.77 percent), Industrials (-2.83 percent), Materials (-3.48 percent), Real Estate (-5.62 percent), and Technology (-6.21 percent). The Energy (+2.65 percent) and Utilities sectors (+0.53 percent) registered a monthly gain.5
What Investors May Be Talking About in September 2022
In the month ahead, all eyes will be on the Fed again when it meets in late September. After two consecutive 75 basis point hikes in June and July, the Federal Open Market Committee (FOMC) will once again be meeting to consider what’s next for short-term rates.
The outcome of this meeting, scheduled for September 20–21, appears more certain following Fed Chair Powell’s Jackson Hole speech. But the Fed has indicated that any potential rate hike will depend upon the economic data leading up to the meeting.
Some see the second consecutive quarter of GDP contraction and declining energy, metals, and food input costs influencing the Fed’s decision. Others believe that comments in August by Powell and other Fed officials that the inflation fight is not over may have thrown cold water on that hope.
![]()
T I P O F T H E M O N T H
![]()
Most homeowner insurance policies do not cover damage from floods and earthquakes. You will need to purchase separate coverage for protection from those calamities.
![]()
World Markets
Weakening economies in Western Europe and China rippled through overseas markets, with the MSCI-EAFE Index falling 4.61 percent last month.6
Losses were posted across European markets, including France (-5.02 percent), Germany (-4.81 percent), and the U.K. (-1.88 percent).7
Pacific Rim markets fared better, but still ended the month mixed. Hong Kong lost 1.0 percent while Australia picked up 0.60 percent.8
Indicators
Gross Domestic Product: The economy shrank at an annualized rate of 0.6 percent in the second quarter, an improvement from the initial estimate of a 0.9 percent contraction.9
Employment: Nonfarm payrolls increased by 528,000 in July, which was double the consensus estimate. The unemployment rate dipped to 3.5 percent, while average worker wages rose 5.2 percent from a year ago.10
Retail Sales: Retail sales were flat month-over-month, but when excluding gasoline and auto sales, consumer spending rose 0.7 percent.11
Industrial Production: Industrial output increased 0.6 percent—double Wall Street estimates—as oil and gas drilling reached a seven-year high.12
Housing: Housing starts declined 9.6 percent in July, as higher costs and mortgage rates pinched new construction activity.13
Existing home sales fell 5.9 percent from the sales in June, as higher interest rates weighed on buyer affordability. It was the sixth consecutive month that existing home sales have declined. Despite the softness, the median sales price rose 10.8 percent from 12 months ago.14
New home sales dropped to their lowest level since 2016, falling 12.6 percent in July. Compared with those a year ago, sales are down by 29.6 percent.15
Consumer Price Index: Consumer prices eased in July but remained near record highs as the CPI rose 8.5 percent year-over-year.16
Durable Goods Orders: Durable goods orders were unchanged from the previous month, though were higher by 1.2 percent when excluding defense orders.17
![]()
Q U O T E O F T H E M O N T H
![]()
“There is no writing that is writing without teachers.”
DAVID BARTHOLOMAE
![]()
The Fed
Minutes from July’s Federal Open Market Committee (FOMC) meeting reflected a broad consensus among Fed officials that additional rate hikes were still required to combat elevated inflation, though acknowledging economic weakness may temper the size and pacing of such hikes.18
“Regarding developments abroad, central banks in advanced foreign economies had quickened the pace of policy tightening in order to address above-target inflation,” according to the July meeting minutes. “Eight advanced-economy central banks raised their policy rates over the period.”19
| MARKET INDEX | Y-T-D CHANGE | August 2022 |
| DJIA | -13.29% | -4.06% |
| NASDAQ | -24.47% | -4.64% |
| S&P 500 | -17.02% | -4.24% |
| BOND YIELD | Y-T-D CHANGE | August 2022 |
| 10 YR TREASURY | 1.62% | 3.13% |
Sources: Yahoo Finance, August 31, 2022.
The market indexes discussed are unmanaged and generally considered representative of their respective markets. Individuals cannot directly invest in unmanaged indexes. Past performance does not guarantee future results. U.S. Treasury Notes are guaranteed by the federal government as to the timely payment of principal and interest. However, if you sell a Treasury Note prior to maturity, it may be worth more or less than the original price paid.
![]()
T H E M O N T H L Y R I D D L E
![]()
Two boxes each hold four hot sauce packets and four soy sauce packets. Without looking, you take one packet from each box. What are the chances that at least 1 of the packets you draw is a hot sauce packet?
LAST MONTH’S RIDDLE: Michael introduces Levi to his friends, stating that Levi’s father is also the son of Michael’s father. But Michael is an only child. So how are Michael and Levi related?
ANSWER: Levi is Michael’s son.
![]()
Guy Woolley may be reached at 415.236.5364 or guy@freedomcapitalmanagement.com
www.freedomcapitalmanagement.com
Know someone who could use information like this?
Please feel free to send us their contact information via phone or email. (Don’t worry – we’ll request their permission before adding them to our mailing list.)
![]()
«RepresentativeEmailDisclosure»
This material was prepared by MarketingPro, Inc., and does not necessarily represent the views of the presenting party, nor their affiliates. The information herein has been derived from sources believed to be accurate. Please note – investing involves risk, and past performance is no guarantee of future results. Investments will fluctuate and when redeemed may be worth more or less than when originally invested. This information should not be construed as investment, tax or legal advice and may not be relied on for the purpose of avoiding any Federal tax penalty. This is neither a solicitation nor recommendation to purchase or sell any investment or insurance product or service, and should not be relied upon as such. All market indices discussed are unmanaged and are not illustrative of any particular investment. Indices do not incur management fees, costs, or expenses. Investors cannot invest directly in indices. All economic and performance data is historical and not indicative of future results. The Dow Jones Industrial Average is a price-weighted index of 30 actively traded blue-chip stocks. The NASDAQ Composite Index is a market-weighted index of all over-the-counter common stocks traded on the National Association of Securities Dealers Automated Quotation System. The Standard & Poor’s 500 (S&P 500) is a market-cap weighted index composed of the common stocks of 500 leading companies in leading industries of the U.S. economy. The Russell 2000 Index measures the performance of the small-cap segment of the U.S. equity universe. The CBOE Volatility Index® (VIX®) is a key measure of market expectations of near-term volatility conveyed by S&P 500 stock index option prices. NYSE Group, Inc. (NYSE:NYX) operates two securities exchanges: the New York Stock Exchange (the “NYSE”) and NYSE Arca (formerly known as the Archipelago Exchange, or ArcaEx®, and the Pacific Exchange). NYSE Group is a leading provider of securities listing, trading and market data products and services. The New York Mercantile Exchange, Inc. (NYMEX) is the world’s largest physical commodity futures exchange and the preeminent trading forum for energy and precious metals, with trading conducted through two divisions – the NYMEX Division, home to the energy, platinum, and palladium markets, and the COMEX Division, on which all other metals trade. The SSE Composite Index is an index of all stocks (A shares and B shares) that are traded at the Shanghai Stock Exchange. The CAC-40 Index is a narrow-based, modified capitalization-weighted index of 40 companies listed on the Paris Bourse. The FTSEurofirst 300 Index comprises the 300 largest companies ranked by market capitalization in the FTSE Developed Europe Index. The FTSE 100 Index is a share index of the 100 companies listed on the London Stock Exchange with the highest market capitalization. Established in January 1980, the All Ordinaries is the oldest index of shares in Australia. It is made up of the share prices for 500 of the largest companies listed on the Australian Securities Exchange. The S&P/TSX Composite Index is an index of the stock (equity) prices of the largest companies on the Toronto Stock Exchange (TSX) as measured by market capitalization. The Hang Seng Index is a free float-adjusted market capitalization-weighted stock market index that is the main indicator of the overall market performance in Hong Kong. The FTSE TWSE Taiwan 50 Index is a capitalization-weighted index of stocks comprising 50 companies listed on the Taiwan Stock Exchange developed by Taiwan Stock Exchange in collaboration with FTSE. The MSCI World Index is a free-float weighted equity index that includes developed world markets and does not include emerging markets. The Mexican Stock Exchange, commonly known as Mexican Bolsa, Mexbol, or BMV, is the only stock exchange in Mexico. The U.S. Dollar Index measures the performance of the U.S. dollar against a basket of six currencies. Additional risks are associated with international investing, such as currency fluctuations, political and economic instability, and differences in accounting standards. This material represents an assessment of the market environment at a specific point in time and is not intended to be a forecast of future events or a guarantee of future results. MarketingPro, Inc. is not affiliated with any person or firm that may be providing this information to you. The publisher is not engaged in rendering legal, accounting, or other professional services. If assistance is needed, the reader is advised to engage the services of a competent professional.
CITATIONS:
1. WSJ.com, August 31, 2022
2. WSJ.com, August 5, 2022
3. CNBC.com, August 10, 2022
4. LipperAlpha.refinitiv.com, August 26, 2022
5. SectorSPDR.com, August 31, 2022
6. MSCI.com, August 31, 2022
7. MSCI.com, August 31, 2022
8. MSCI.com, August 31, 2022
9. FoxBusiness.com, August 25, 2022
10. CNBC.com, August 5, 2022
11. WSJ.com, August 17, 2022
12. MarketWatch.com, August 16, 2022
13. WSJ.com, August 16, 2022
14. WSJ.com, August 18, 2022
15. FoxBusiness.com, August 23, 2022
16. CNBC.com, August 10, 2022
17. WSJ.com, August 24, 2022
18. WSJ.com, August 17, 2022
19. Federal.Reserve.gov, August 17, 2022