

April 10, 2023
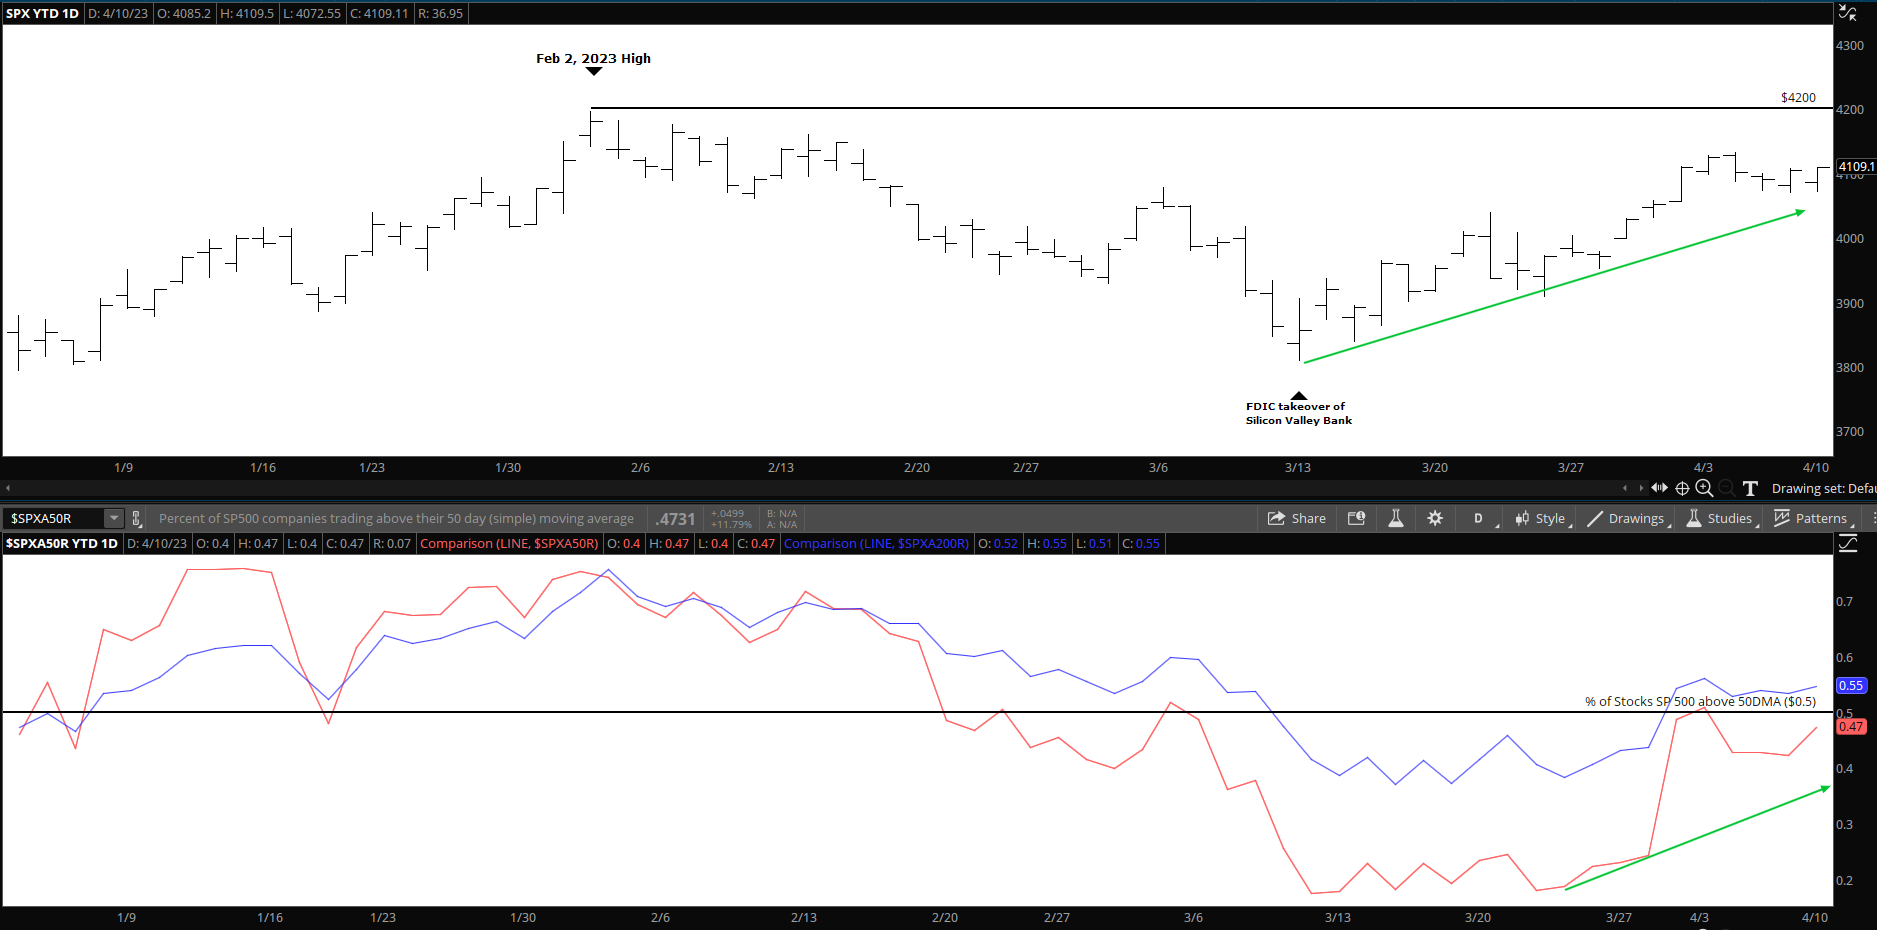
One of the indicators I always mention in the letter is the percentage of stocks above their 50-day moving average and above their 200-day moving average in the S&P 500. In my experience, I am most comfortable with at least 60% of the stocks above their 200-day moving with the 50-day moving average above the 200-day moving average. There are 2 comparison charts below. The top chart is a year-to-date chart of the S&P 500 and the chart below is the percentage of stocks above the 50-day moving average in red and the percentage of stocks above the 200-day moving average in blue. The highest close for the year so far for the S&P 500 was on February 2nd. At that time the stocks above their 50-day and 200-day moving averages were above 70 percent. From that time until March 13th both the 50-Day and 200-day declined with the S&P 500. The percentage of stocks above the 50-day declined to below 20% when the Silicon Valley Bank failure news hit the markets on March 10th, that reading was very bearish!
In last month’s newsletter, I assumed that the Silicon Valley Bank issue would be dealt with “swiftly” and First Citizens Bank has already purchased most of its business. Going forward we need to see the markets strengthen with more stocks trading above their 50-Day moving averages and the S&P 500 making higher highs for the year. This week’s economic data tracking the price of Consumer goods and Producer prices will be an indication if inflation is coming under control. While the market is trading better than it did last year, the Federal Reserve is still concerned with inflation.
The VIX Index: On Friday the VIX index closed at 18.40. 3/10 the VIX was at 24.80. On March 1st it was at 20.58. A falling VIX is generally bullish for the markets.
Percent of stocks above their 50-day and 200-day moving average: On March 1st, 40% of stocks were above their 50-day moving average, today 47% are above their 50-day moving average. Last month 53% of the stocks were above their 200-day moving average, today 55% are above their 200-day moving average. These numbers, while not bullish, confirm some strengthening since the Silicon Valley Bank failure.
Federal Reserve: The next Federal Reserve announcement will be on May 3rd. The CME FedWatch Tool at this time is predicting a 69% chance the Federal Reserve will raise interest rates by another .25 basis points.
Employment Rate: Total nonfarm payroll employment rose by 236,000 in March, and the unemployment rate changed little at 3.5 percent, the U.S. Bureau of Labor Statistics reported on Friday April 7th. Employment continued to trend up in leisure and hospitality, government, professional and business services, and health care.
Inflation Rate: The annual inflation rate for the United States was 6.0% for the 12 months ended February, following a rise of 6.4% in the previous period, according to U.S. Labor Department data published March 14, 2023. The next inflation update is scheduled for release on April 12 at 8:30 a.m. ET, and it will provide information on the rate of inflation over the 12 months ended March 2023.
The 10-year Treasury index yield: The rate today is at 3.41%. On March 1st it closed at 3.99%. The intra-day high so far for this year was on March 2nd at 4.09%.
To view past Market Newsletters, go to www.freedomcapitalmanagement.com. On the home page are recent newsletters, for older newsletters go to the blog page tab at the top of the home page.
Today’s Closing summary:
M